Embracing the Power of Power BI: The Factory Model Approach

Chandrasekhar

Data and AI are reshaping the way enterprises operate in today’s dynamic business scenario. Irrespective of their age and size, organizations are adapting to modern ways of strategy planning, empowered by cutting-edge business intelligence (BI) tools, data mining, data classification & visualization, and analysis. BI is the foundation of modern organizational structure and promotes data-driven decision making as a culture at all levels of the enterprise. Power BI by Microsoft is a powerful Business Intelligence technology designed to integrate and simplify the use of complex data for top, middle, and even lower management. By empowering analytics, it helps organizations to translate data into meaningful insights, and improve enterprise efficiency by quickly adapting to market changes.
Driving Data Culture with Power BI: Core Capabilities & Add-ons
In most organizations, data sources are scattered and varied. Incompatibility of resources combined with limited visualization abilities result in underutilization and sometimes even loss of critical data assets. Power BI bundles software’s, apps and connectors that connect your data resources into one coherent set to derive deep actionable and interactive insights. It makes data more insightful, visually impressive, and easily shareable. As a package, Power BI comprises a Windows application, an online SaaS service and Power BI mobile apps for Windows, iOS, and Android devices.
Aimed at bridging the gap between data and strategic decisions, Power BI breaks the process into three easy steps:
1. Converting data into easily understandable reports and visuals
Power BI Desktop application allows you to access data from a myriad of cloud based sources, make data prep and modeling easier than ever, draw deep actionable insights and create rich, interactive reports with visual analytics for free.
2. Connecting multiple data sources
Power BI in the cloud enables easy report sharing, scaling, and collaboration while maintaining complete data accuracy and security. Using professional and premium versions, enterprises can avail benefits and services that suit their specific collaboration, publishing, and consumption needs. A simple pricing and features comparison can help you determine which version is best suited.A Power BI Pro license lets you collaborate with colleagues, model data, author content, share dashboards, publish reports, and perform ad-hoc analysis. To read and interact with pre-published dashboards and reports, you can choose either a per-user Power BI Pro license or a Power BI Premium license for large-scale databases.
3. Making the information shareable
Power BI is a modern tool that’s compatible with a wide range of applications such as Microsoft Teams and Excel so that everyone involved in strategic decision-making works with the same data to achieve broader organizational goals. The free Power BI mobile app for Android, iOS, and Windows Mobile takes shareability to the next level by allowing users to view and collaborate on reports and visualizations on the go. It gives a secure access to view live Power BI dashboards and reports on any device. Needless to say, when fluid data visuals are on your fingertips, insights based on real time data become the new superpower of all teams.
Integrating Power BI with Microsoft APIs can help businesses drive holistic growth in terms of operational efficiency and promote an overall data-centric approach. By using Power BI with completely compatible tools like Azure and MS office, data can be unified and visualized securely. It helps in encouraging usage of data analytics and business intelligence at all organizational levels by modernizing reporting, converting data into more digestible (visual) formats and providing end to end data protection. Integrations empower important decisions with solid, scalable, and secure data and support shareability through a wide range of APIs. Let’s understand this better.
Power BI and Microsoft Azure
Opening up massive possibilities through improved collaboration and decision making, Power BI and Azure is a cracking combination for developing visualization and reporting capabilities, collaborating seamlessly, and extracting maximum value from your data. Using Power BI with Azure apps improves analytics infrastructure management within a single interface, along with reduced time-to-insights and massive scale and flexible storage for data of any size or type.
Also, data analysis improves a great deal when you combine Power BI with the open source technology of Azure Databricks, or study structured or unstructured data using AI-powered features built into Power BI. Connect Power BI to Azure to explore more.
Power BI and Microsoft Office
Integrating Power BI insights with Office capabilities allows you to do so much more with your data. You can collaborate on directly shareable reports using Microsoft Teams, get broad data analytics and visualization capabilities by combining with Excel with Power BI, embed interactive reports in SharePoint Online, export the same reports to PowerPoint as high-resolution images, turn your Visio diagrams into interactive visualizations, and control your data with Microsoft Information Protection and Cloud App Security.
Embracing Power BI with the Factory Model Approach
As more and more organizations consider consolidating into an enterprise BI platform, WinWire recommends a Factory Model to enable enterprise adoption of Power BI as the strategic Tool. The easy to implement model suggests gradual migration of all business intelligence & visualization assets from other tools to Power BI following a step-by-step process. Direct benefits of WinWire’s factory model with Power BI will be visible in the form of improved efficiency and over 30% reduction in development cost through leverage of a global delivery model. It also helps in managing licensing costs via creative application designs and thought leadership. The factory model emphasizes on standardization of best practices and developing modern capabilities with high quality, predictability, and faster turnaround. Powered with Power BI, it adds value by simplifying and consolidating reports and visualization on a world class platform and delivering consistent and interactive user experience.
Key deliverables of the Power BI Factory Model Approach are:
- Assessment report
- Execution roadmap
- Pilot migration delivery for a prioritized area, and
- Scale-up roadmap / plan
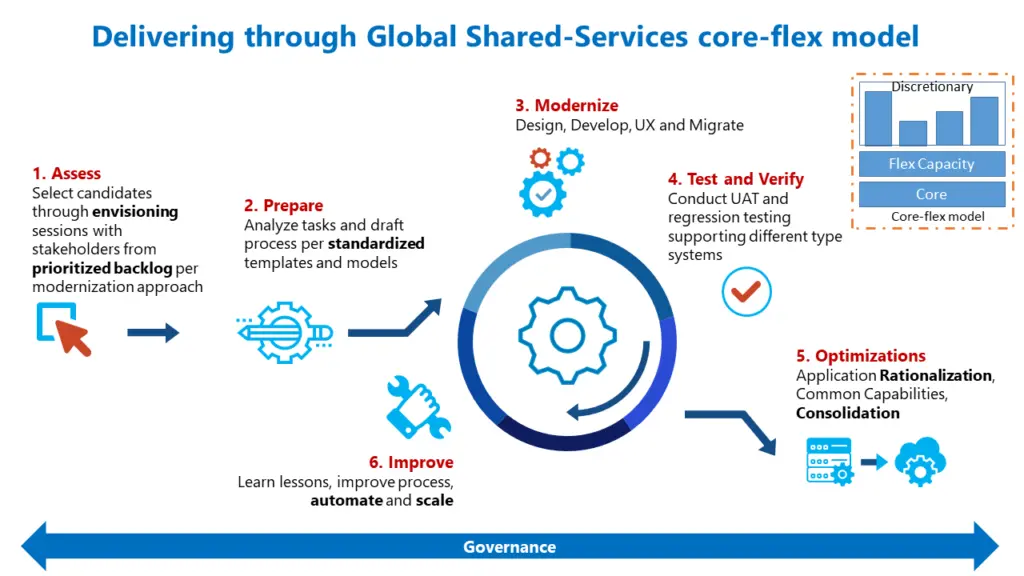
For a better understanding, the migration process can be divided into following steps:
- Assessing the current BI footprint, identifying inventory and data that needs to be migrated to BI, mapping consumer needs to respective Power BI features.
- Determining the execution process and functionalities to deliver as part of larger roadmap and strategy
- Planning & preparing for the pilot, along with execution and scaling details
- Testing and conducting User Acceptance Testing
- Optimizing processes, resources, and costs
- Automating and scaling
Leading the Change with Power BI Migration using Factory Model
Rated consistently as a leader in analytics, Power BI is a remarkable tool in BI and Visualization with industry leading features that include unified self-service and enterprise analytics, accelerated big data prep, ability to leverage latest advances in Microsoft AI, improved publishing efficiency and accuracy of BI content, unparalleled integration capabilities, and streaming analytics in real time. Companies from almost all industries are willing to migrate to Power BI. Tying it with WinWire’s factory model approach makes migrations deliver outstanding improvement in overall efficiency of the business.
Recently, WinWire helped a leading animal healthcare company, by leveraging its Migration-as-a-Service offering to elevate business efficiency and reduce cost. This included converting over 40 reports that were built using SSRS and Business Objects, to Power BI The SSRS reports presented a unique complexity in the form of “Data Driven Subscription” feature that is not currently supported by native Power BI.
WinWire’s solution resulted in re-platforming SSRS reports and Business Objects reports to Power BI by leveraging leading technologies such as, Azure Logic Apps, Power Platform and Power BI service on Azure. The stepwise Power BI Factory model approach helped improve business efficiency and the customer experience by moving to a superior platform while realizing a 30% reduction in hosting cost.
WinWire’s Power BI Factory model approach is helping many global companies to ensure a smooth migration to Power BI and meet the ever-increasing dependency on data-driven decision making and strategy planning, globally. Stay tuned for more case-studies on Power BI solutions with WinWire.