Introducing Azure Synapse Analytics Studio

Chandra
Today’s enterprise analytics requires enterprises to operate at a large scale on any data to facilitate better decision making. In the past, building analytics solutions requires organizations to stitch together big data and data warehousing technologies such as Spark and SQL to achieve results. Further, they were also needed to integrate them into rich data pipelines that work across relational and data lakes data.
Azure Synapse Analytics is an integrated analytics service that accelerates time to insight from all data at any scale, across data warehouses and big data analytics systems. It brings together the best of the SQL technologies used in enterprise data warehousing, Spark technologies are used in big data analytics, and Pipelines to orchestrate activities and data movement.
Azure Synapse Analytics Studio enables data engineers, data scientists, and IT professionals to collaborate. It is a place where they can develop end-to-end data solutions within a unified platform and experience.
At first, sight, when we open the Azure Synapse Analytics Studio, we find the following screen:
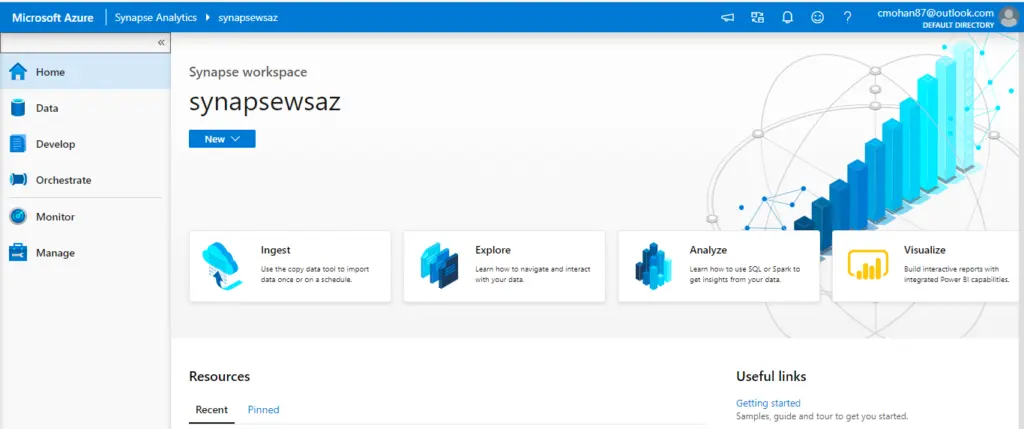
Left side panel, Azure Synapse Analytics Activity Hubs:
- Home: Welcome/initial section (the one highlighted in the screenshot)
- Data: Explore our data inside Azure Synapse Analytics (Storage Accounts, databases, datasets)
- Develop: Create SQL Scripts, Notebooks, Data Flows, Spark Jobs, Power BI Reports
- Orchestrate: Define and create Azure Data Factory data movement pipelines
- Monitor: Monitor the execution of Azure Data Factory activities to ensure that they are running without errors, monitor Spark activities and your SQL Pools
- Manage: Grant access to different users, manage Azure data factory linked services, integration run-times and triggers
Introduction of Data Hub
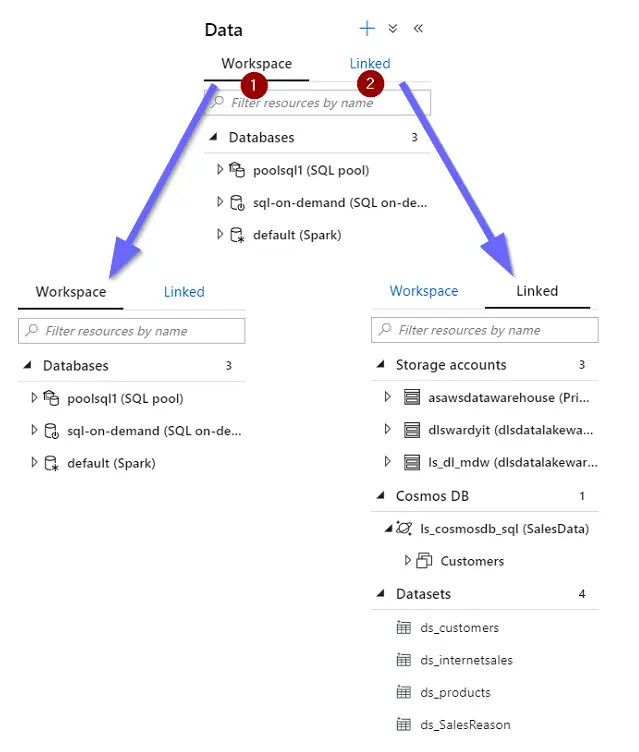
Now, we will step into the data hub first, we could see the data hub has two main sections.
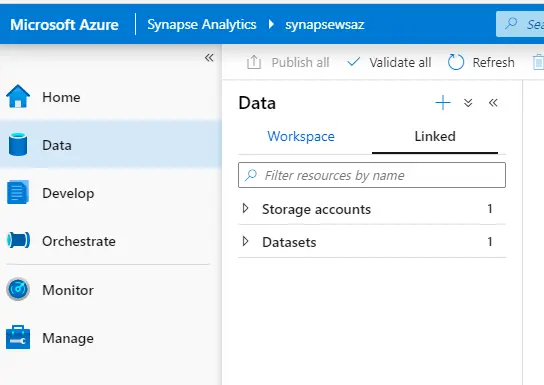
1. Workspace: with data assets that belong to the Azure Synapse Analytics Workspace. For example:
- SQL Pools: A distributed query system that enables enterprises to implement data warehousing and data virtualization scenarios using standard T-SQL experiences familiar to data engineers. It also expands the capabilities of SQL to address streaming and machine learning scenarios. It offers both serverless(on-demand) and provisioned resource models, offering consumption and billing options to fit your needs.
- Apache Spark Pools: Deeply and seamlessly integrates Apache Spark–the most popular open-source big data engine used for data preparation, data engineering, ETL, and machine learning.
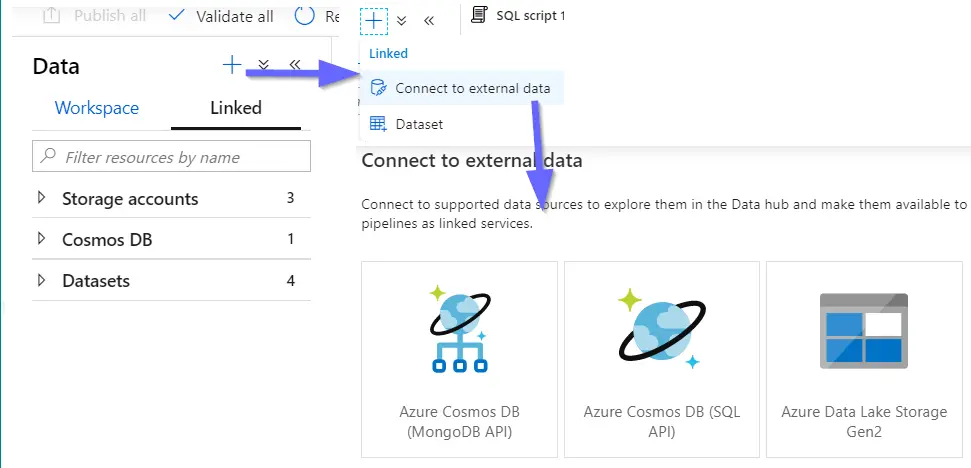
2. Linked: with data assets linked from other services. For example:
- Storage accounts
- Cosmos DB
- Datasets
Connecting an external database (supported data sources Azure Cosmos DB and Data Lake Storage Gen2) is done as a linked service. A linked service enables us to browse and explore data, read, and write from Apache Spark for Azure Synapse Analytics or SQL into Cosmos DB or Data Lake Storage Gen2.
Azure Synapse removes the traditional technology barriers between using SQL and Spark together. SQL and Spark can directly explore and analyze Parquet, CSV, TSV, and JSON files stored in the data lake. It facilitates no Extract-Transform-Load (ETL) analytics in Azure Synapse Analytics against your operational data at scale.
Introduction of Developed Hub
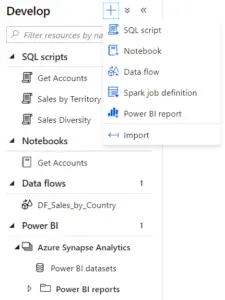
Azure Synapse Analytics Studio Develop Hub offers a wide range of development options, from building Azure Data Factory data flows to building Power BI Reports.
With the Develop Hub in Azure Synapse Analytics we can develop:
- SQL Scripts
- Notebooks
- Data Flows (Azure Data Factory)
- Spark Job Definitions
- Power BI Reports
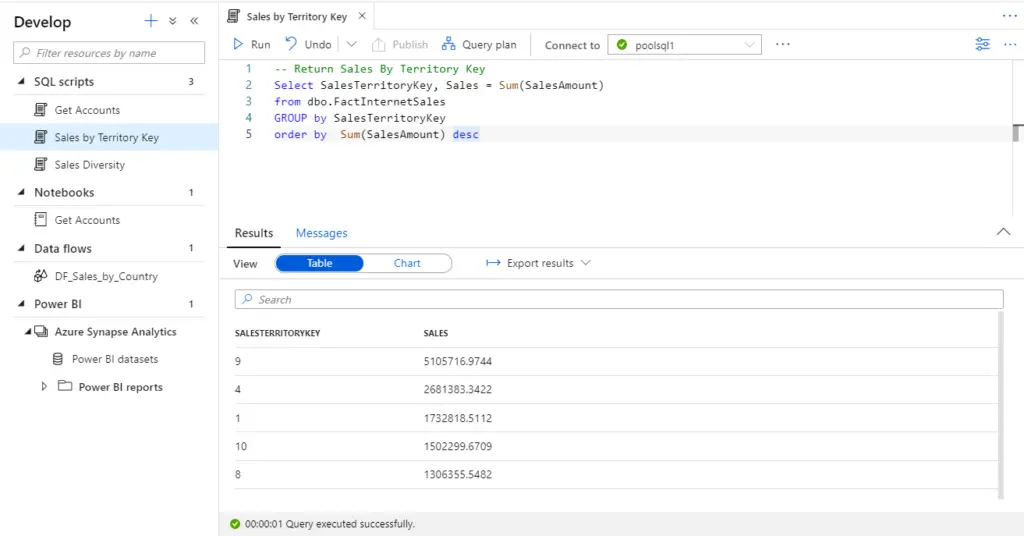
Authoring SQL Script
We can develop SQL Scripts with IntelliSense; we will be able to execute our scripts using SQL pool (on-demand or provisioned) and there are two different types of outputs:
- Table
- Chart
The default output view is Table. The table view results can be exported to Excel, CSV, and JSON.
We can change the view type to chart after query execution completes.
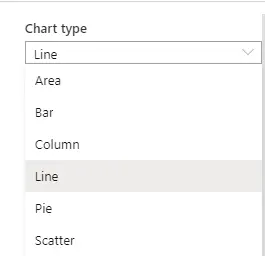
Chart: Chart result can be saved JPEG, PNG, and SVG.
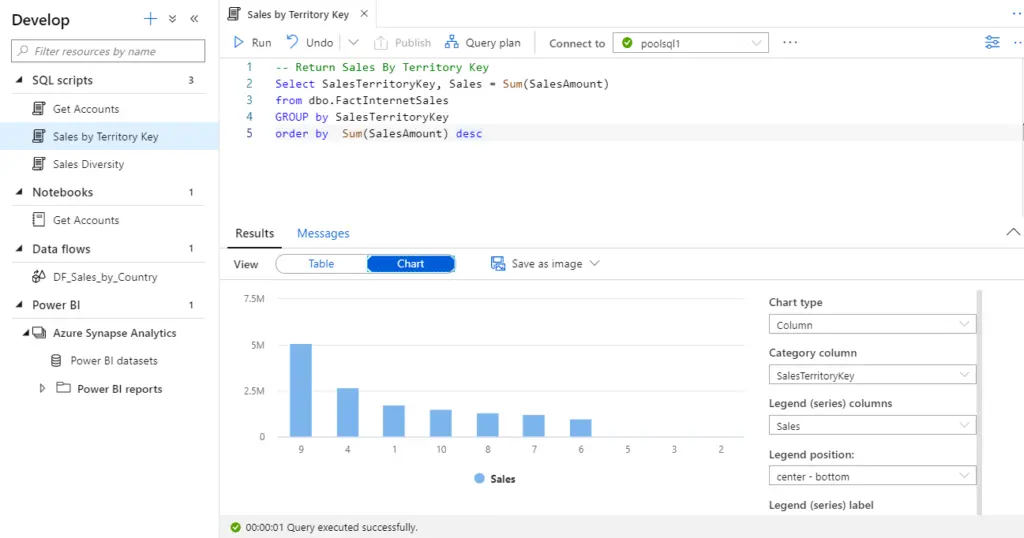
Synapse providing six different types of charts:
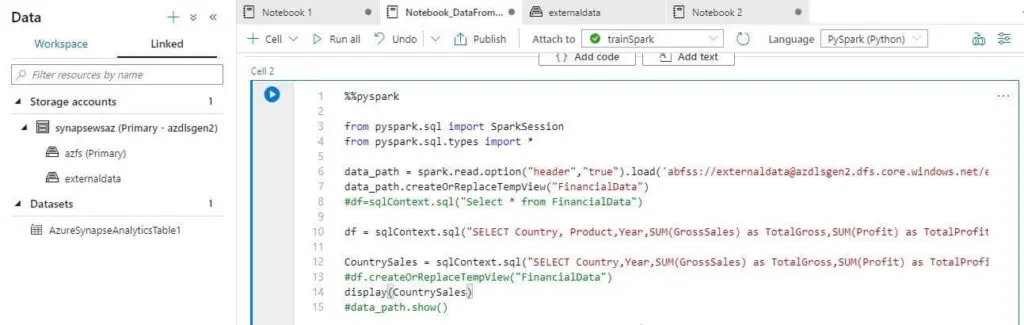
Authoring Notebook
Azure Synapse Analytics combines the best elements of Jupyter Notebooks or Databrick.We can create notebooks using any of our favorite languages:
- Python
- Scala
- C#
- Spark SQL
Note: Default language is PySpark,Business analysts, data engineers, and data scientists can now use the above languages interchangeably to run near real-time business intelligence, analytics, and machine learning pipelines. To change the language use the following syntax %%<<language>>.
We will be able to execute the notebooks by using our Spark pools
Notebook execution results give two different types of outputs:
- Table
- Chart
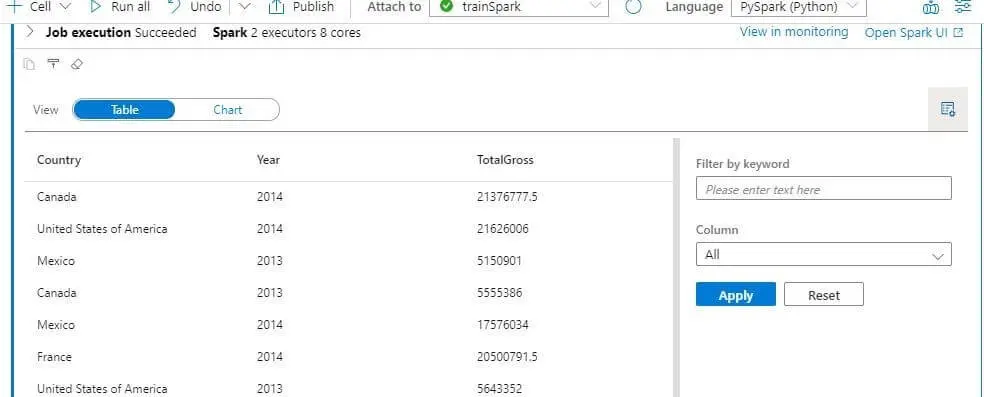
Table view
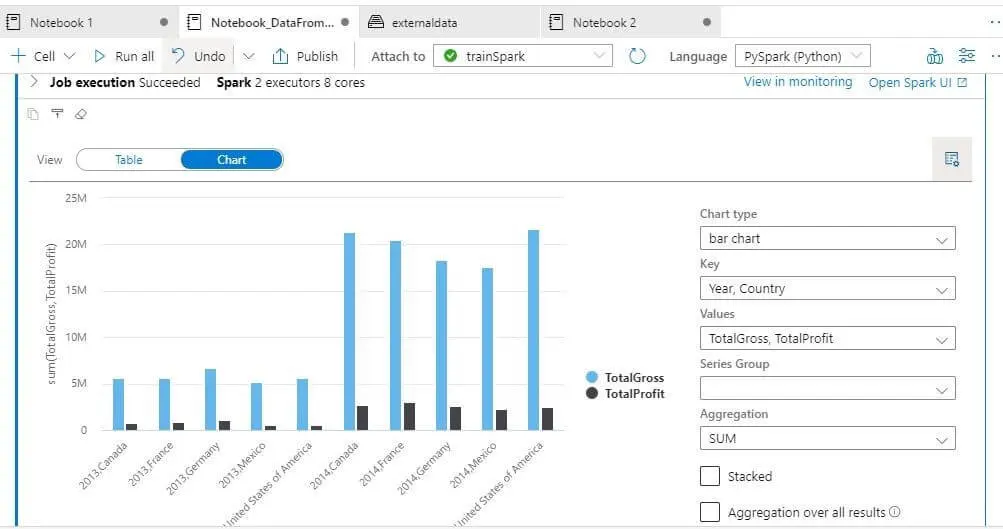
Chart View
Conclusion
The data hub offers a no-code experience for the users, enabling them to start exploring data without having a strong technical background. This user-friendly experience is one of the key reasons why Azure Synapse Analytics will be a game-changer. As we have seen, it is possible to develop everything without leaving Azure Synapse Analytics Studio, which is essential for promptly getting actionable insights and solutions. I am coming up with a new blog on Azure Synapse Analytics with Power App’s Common Data Service, so stay tuned for more updates.