How to Disable Values in Filter Pane for Filters in Power BI Report

Raghavender

Power BI provides offers rich visual that interacts well with the other visuals that are included on a Power BI report. However, one of the main complaints has been that the slices use up very precious screen real estate, especially when you are trying to add in data visuals onto a report.
Filters were previously available in Power BI, but Microsoft has upgraded the functionality of filters within Power BI. Through this blog you can quickly learn how you can disable values in filter pane in a Power BI and how you can leverage it.
Filters in Power BI Report
Disable Aggregated Values in Filter Pane
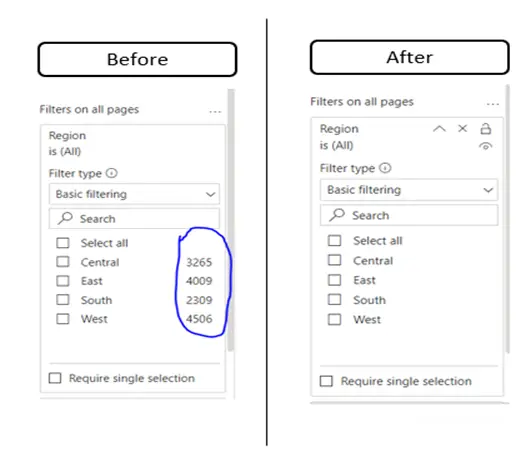
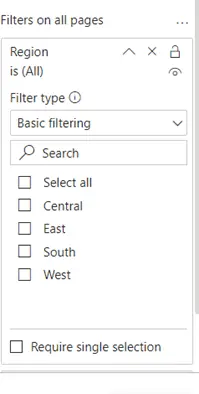
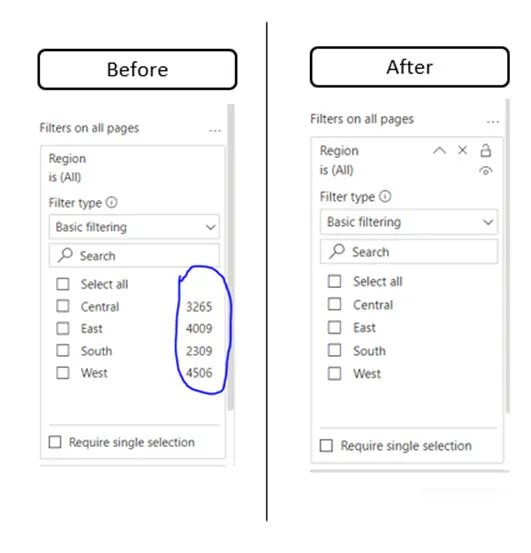
- Some of your customers might come up with unique requirement, where they want to disable values in filters which are appearing Filter Pane. Like the below screenshot, it reflects the before and after results.
2. With simple clicks you can do these changes in report at Power BI desktop or Services
Desktop Version
3. How to make changes in Power BI desktop
- Open the PBIX or Power BI file, which you want to make changes in the report
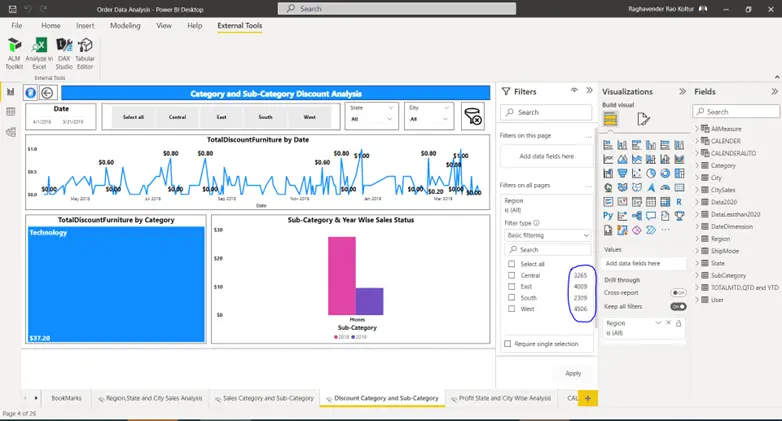
- Screenshot of my PBIX file before making changes
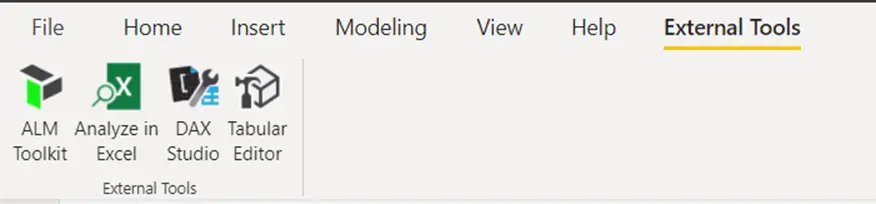
- If you are using updated version of Power BI desktop, then you will see the External tools option in Menu Bar, below screenshot for your reference
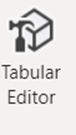
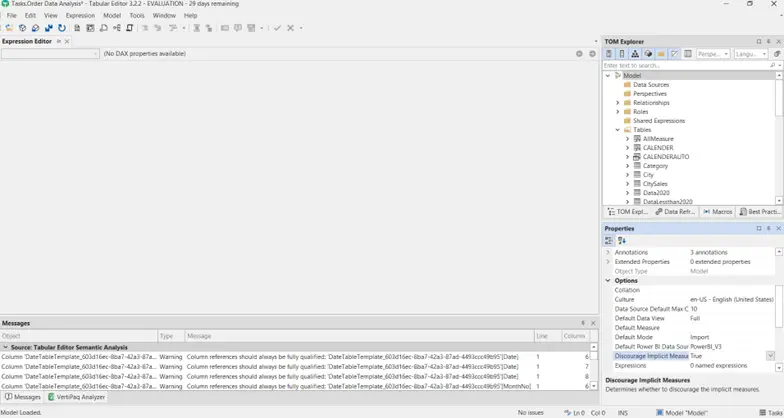
- Now do a single click on “Tabular Editor” Icon in External Tools
- After a click, you will see “Tabular Editor” UI on your screen (usually it will take 10 seconds to option this UI)
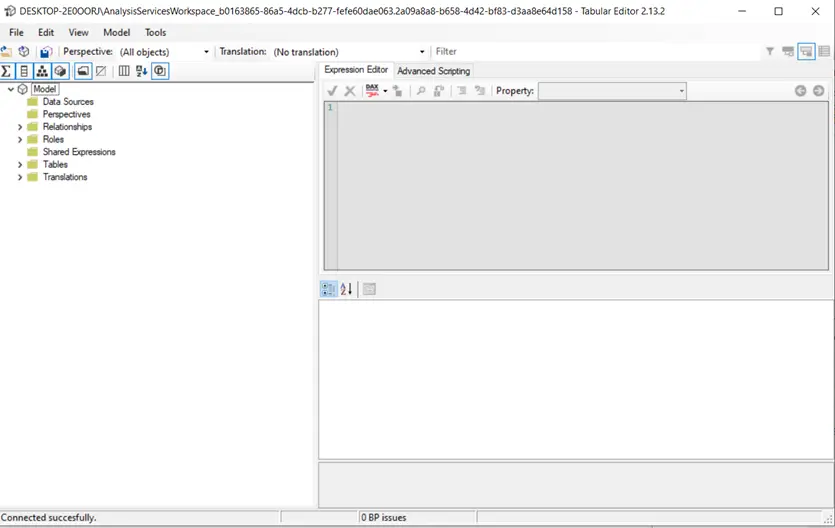
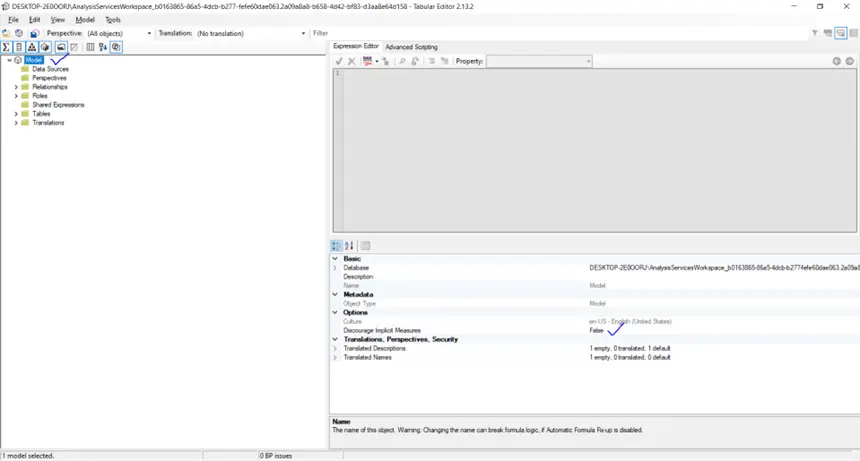
- Select Model and go to Options->Discourage Implicit Measures
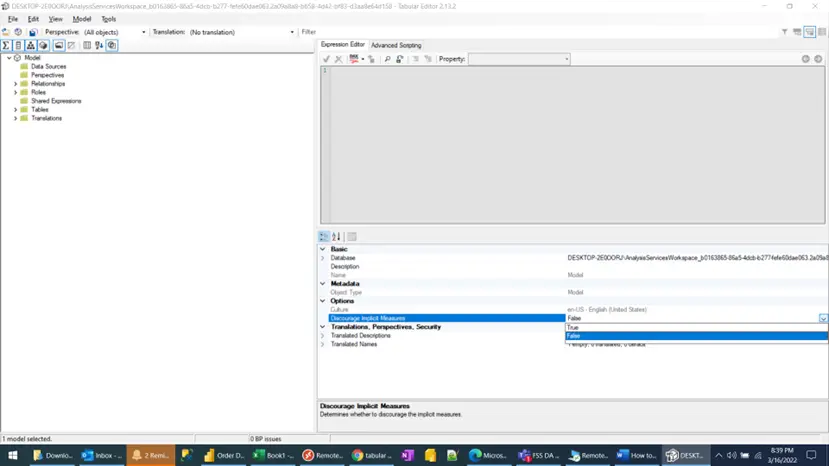
- Change False to True
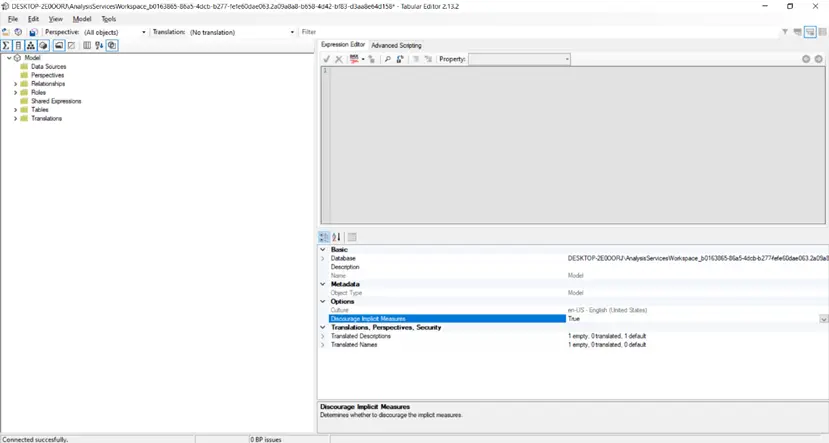
- Below screenshot after changes
Power BI Service Version
4. How to make changes in Power BI Services
- To do this activity, we need Tabular Editor Application or Software installed in our laptop or desktop
- First, let’s see how to install Tabular Editor Application or Software in our laptop or desktop
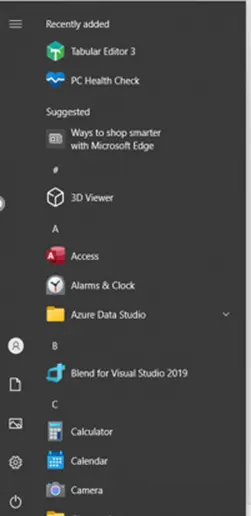
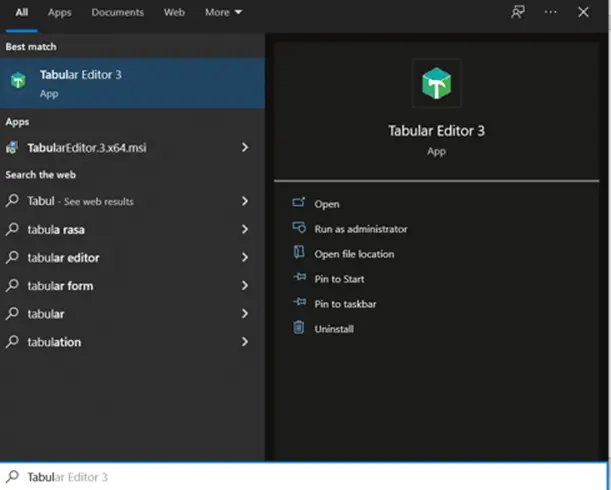
- Once you installed Tabular Editor in your laptop or desktop, you will see the Tabular Editor Application in Windows Menu, or you can find in Windows Search Box by typing Tabular Editor
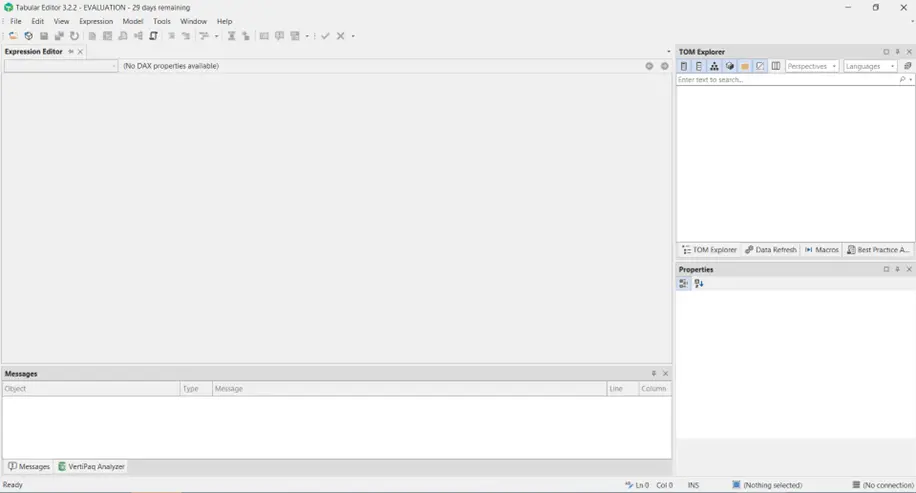
- Open Tabular Editor (Currently I am using trail version with my official email address)
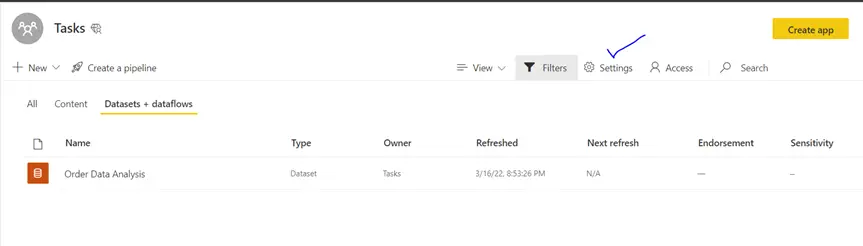
- Go to Power BI services and Open the Workspace in which you want to make changes
- Please note that Workspace in which you want to make changes it should have Premium Per User or Premium Per Capacity or Embedded Capacity or Licensed
- Once you open the Workspace in Power Bi services then click on settings
- As of now I am using Premium per user trial version
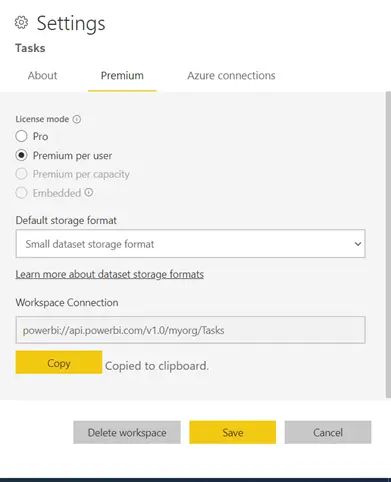
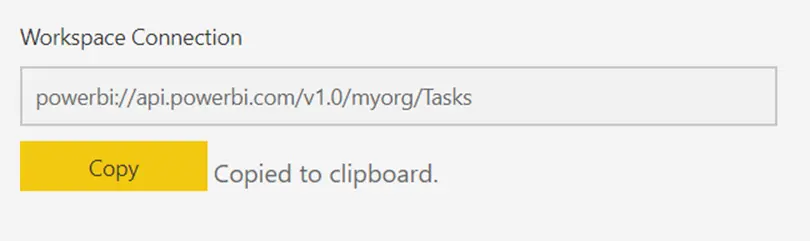
- Click on Copy option
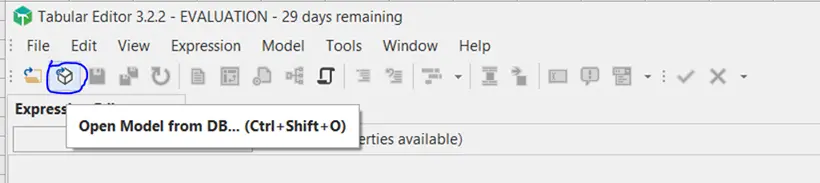
- Go to Tabular Editor Application->Click on below highlighted option in Tabular Editor
- Paste the copied URL in Server
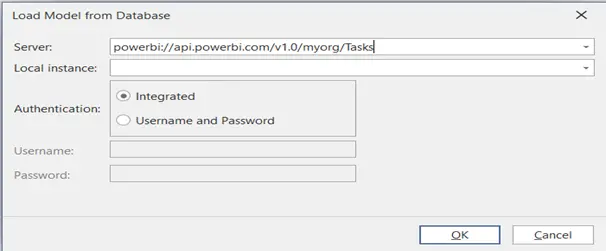
- Click on Integrated or Give User and Password – When you click on Integrated option, it will take you through the Microsoft application for email address and password, please follow those steps
- Once you are done above step, you will see the below screenshot, in which you will see all the list of reports in select workspace, as of now I have only one report in this workspace
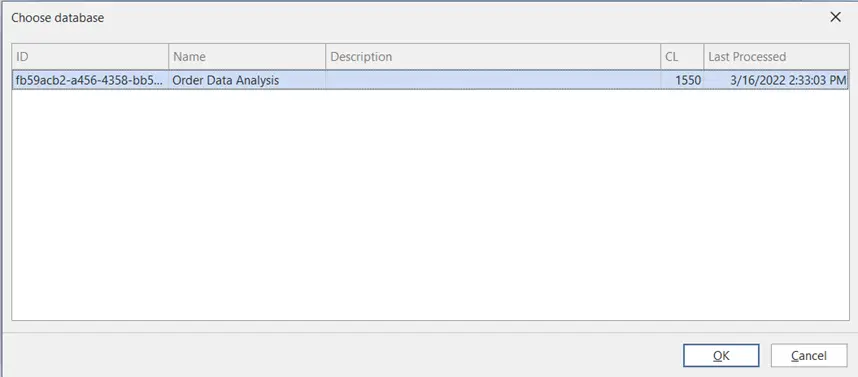
- Click on OK
- Click on Model ->Go Properties->Options-> Discourage Implicit Measures
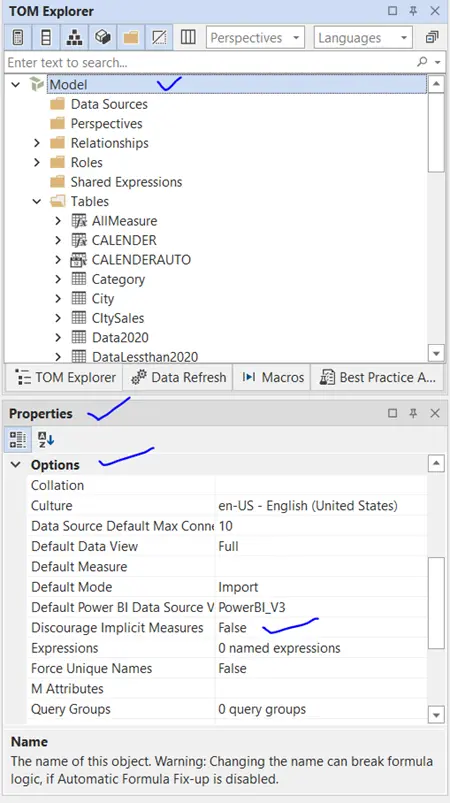
- Change from False to True
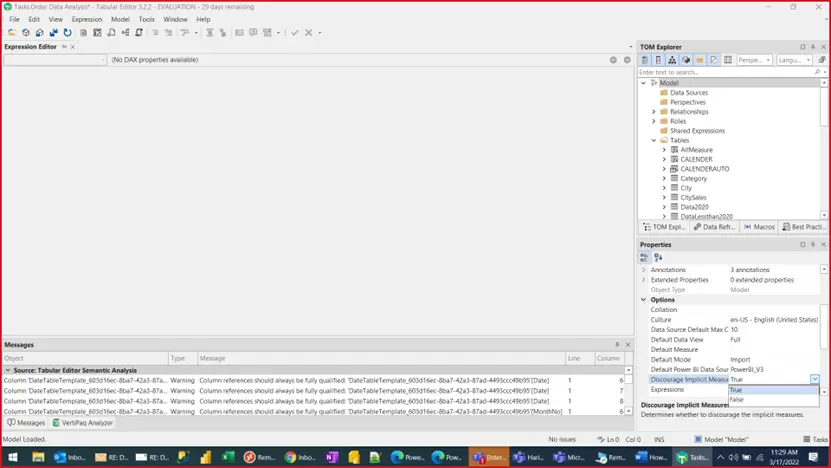
- Do Ctrl+S on your keyboard to save changes
- Below screenshot shows before and after results from Power BI services of the report
Advantage of making “Discourage Implicit Measure” as True, it will improve the performance of Power BI report by using only Explicit Measures
Disadvantage of this activity is that user will not be able to convert implicit measure (fields from table’s) as aggregated value like First, Last, Count, Count (Distinct), Sum, Maximum, Minimum, Average, Variance, Mean and Standard Deviation.
Conclusion
The new filter pane functional provides a rich alternative to Power BI slicers while at the same time limits the amount of report real estate required for the filtering process. Hope this blog will help you to solve the unique problem.