Power BI Performance Optimization

Alekhya

Power BI is a Data Visualization and Business Intelligence tool which is used for developing reports having different kinds of data sources. Creating reports are very specific to the requirement given by user. Implementing few of the requirements might worsen performance of the report. User will be more concerned to use the reports that loads fast. As we know once the report is published, multiple report consumers will be accessing simultaneously to get the insights on their own data. To display the report in short period of time, below mentioned ways can be pursued.
After developing the Power BI Report along with proper testing of data, the main important factor would be performance. Few questions evolve like How my report or each visual is loading? Is there any visual which takes times in loading? Report loading might take time due to many reasons such as huge data, too many visuals in same page, unwanted columns & measures, due to few DAX queries, etc. Performance can be improved by overcoming the above-mentioned things and can be analyzed more by using below tools.
- Performance Analyzer (Inbuilt tool in Power BI Desktop)
- DAX Studio (Free tool can be downloaded)
- Vertipaq Analyzer (Free tool can be downloaded)
Below mentioned points need to be considered when you are handling large volumes of data that is around 300 million or when the report size is more than 1GB which affects the performance –
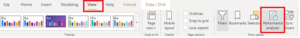
1. Performance Analyzer: It is the inbuilt feature available in Power BI Desktop and can be navigated in ribbon Click on the view tab > Show Panes > Performance Analyzer.
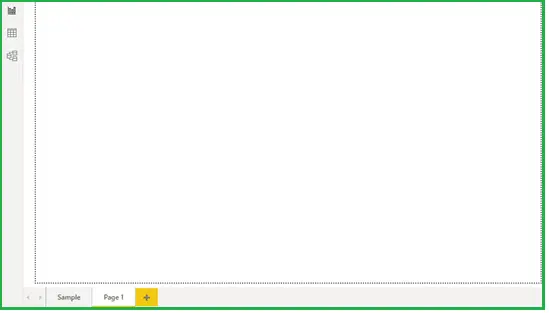
For the correct results open the report with the blank page and then do Start Recording.Next navigate to the page and get the results as shown below.
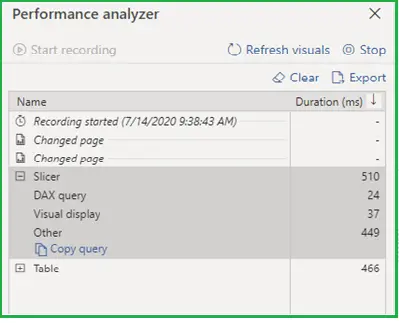
Performance Analyzer shows the time taken by each visual to load in Power BI report.
Besides there are 3 options under the each visual-
- DAX Query – It gives the total time taken to execute the DAX query. This can be reduced by modifying the measure created using DAX expressions or by doing some operations on top of visual like clearing sort option, reducing the default level of drill down, reducing the blank filters applied on top of visual in filter pane.
- Visual display – It gives the total time taken for the visual display. Custom Visuals take long time to load, this can be ignored if not required.
- Other – It gives the waiting time taken to load other visuals and time taken for other operations.
We need to notice one important thing here. For the first time report might take some time to load, but for the next subsequent loads it will take less time. As data will be cached.
As shown in the above screenshot you can copy the query and analyze more in DAX Studio application.
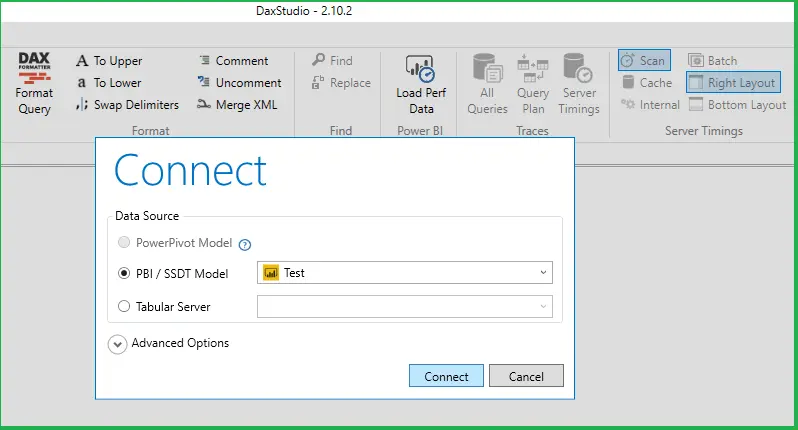
2. DAX Studio: This is the tool used to analyze more on DAX queries so that we can modify the measures and reduce the DAX query time shown in “Performance Analyzer”. After opening DAX Studio, connect to the Power BI Report by selecting ‘PBI/SSDTModel’ option as shown below.
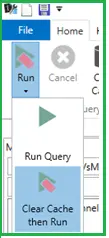
Once report is connected in DAX Studio, select “Clear Cache then Run” option before executing the query.
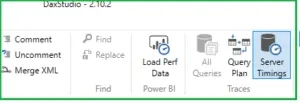
Next enable “Server Timings” option under Traces to see the results below.
Post that copy the DAX Query and execute (F5) the query to see the time taken by query.
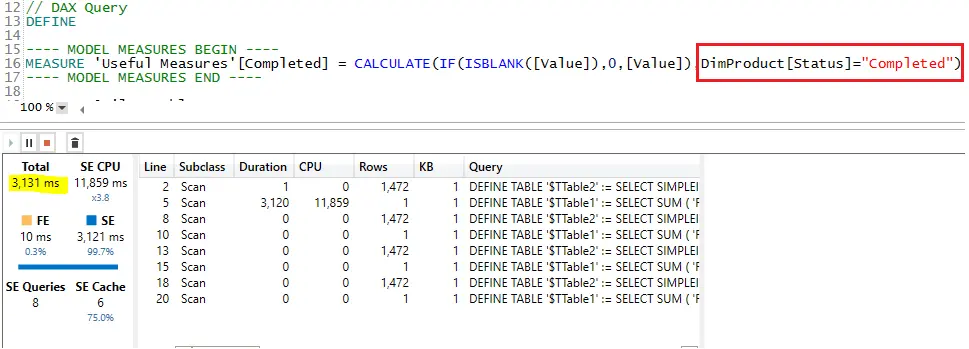
- DAX measures: Filter Function in Calculate () – Apply filter directly in the Calculate function rather than using Filter function. Example – Using Filter() function took 6.5 seconds
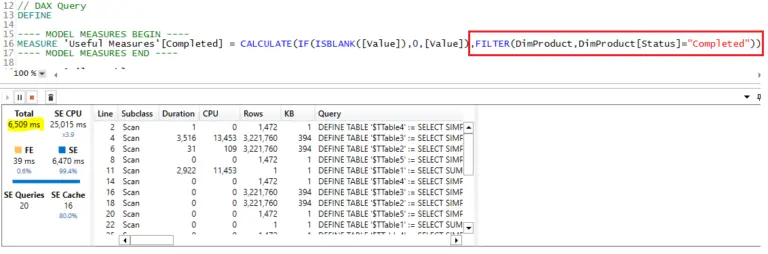
Without Filter() function took 3.1 seconds
- If any flag column is required like ‘True/False’, go with the values 1 or 0 instead of ‘True/False’ this speeds up the visual display.
- DistinctCount function takes long time to execute DAX query. So, try to ignore this function if it is not required in report.
Instead DistinctCount(DimProduct[ProductKey]) can be replaced by using SUMX(Values(DimProduct[ProductKey]),1).
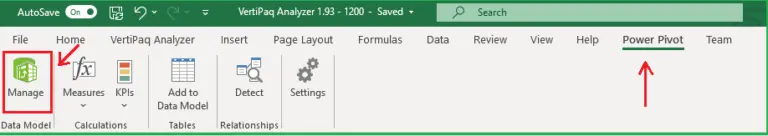
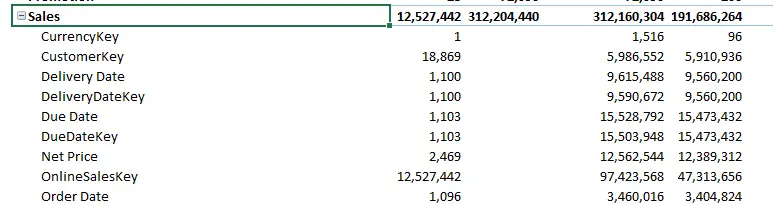
3. Report Level Modifications: Try to reduce the report size by removing unwanted columns like which are having big string values. Reducing the size of the report improves the performance of report. You can find the memory consumed by that column using “Vertipaq Analyzer” application. This is an excel which can be easily downloaded by searching in any of the browser.
Steps to check on column size in Vertipaq –
- Open Power BI Report that you wanted to improve the performance.
- Open DAX Studio and connect to the Power BI report that you have opened before.
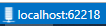
- After connecting to the DAX Studio, you can see localhost number at the bottom right corner. Copy the number and connect to connection in “Vertipaq Analyzer”.
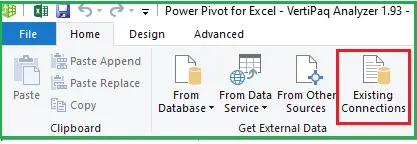
- In Vertipaq Analyzer Excel open the Power Pivot data model.
Please find below screenshots –
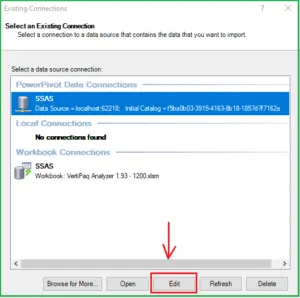
> Next click on Existing Connections
> Select SSAS connection and click on Edit
> Click on Build option.
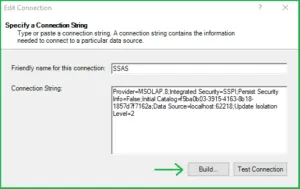
> Provide the localhost details and point to the correct catalog.
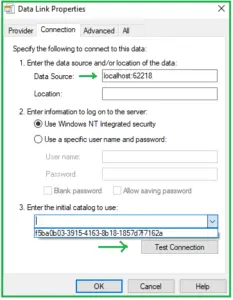
Post that do Test Connection, once it is succeeded you can save and refresh the connection. The table and column details will be refreshed in report.

Here you can see the table size and column size details. By default, it gives the table level information. Once expanded you will get to know the column level details. So, expand any of the “Row Labels” and then you can see the list of columns in each table created in the report and size of the columns used.
- Remove unnecessary Datasets, measures in a report. It improves performance
- Less number of visuals loads the report faster. Remove repeated visuals which shows same data all over the report. If there are many visuals prefer moving them to another page of the report rather than placing all of them in same page.
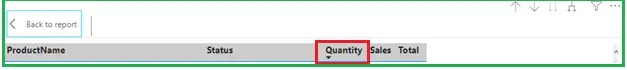
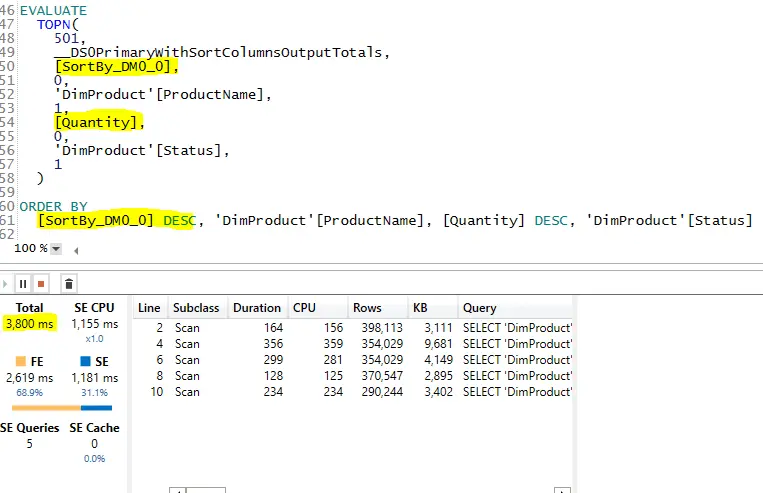
- If Matrix is used in report, by default never provide sorting functionality based on measure. It affects the performance to load the visual/report. (can see the better change in results if data volume is huge)
Example – With Sort option in matrix on top of measure in report-
In DAX Studio query took 3.8 seconds –
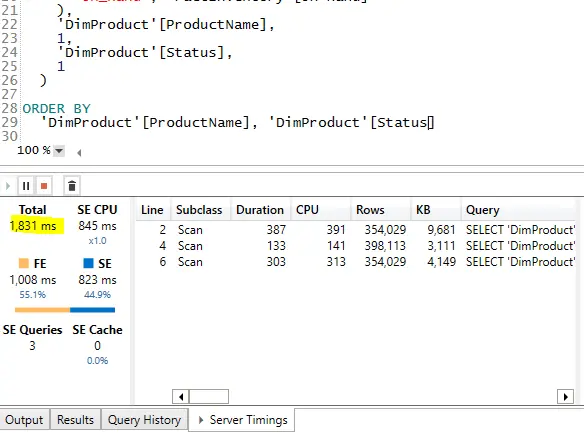
Without Sort Option in matrix –
In DAX Studio query took 1.8 seconds –
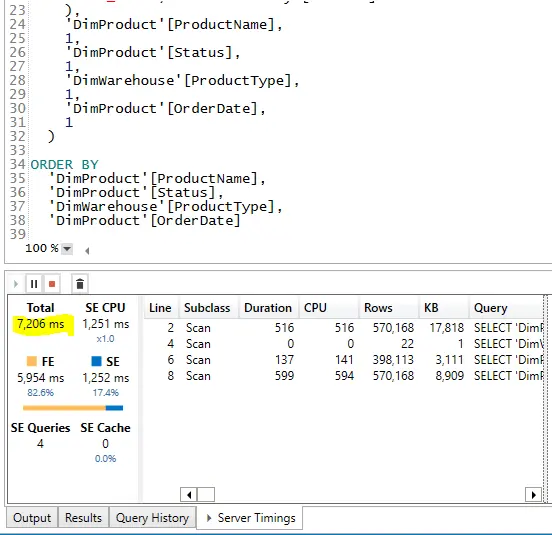
- In Matrix by default show only up to 1st or 2nd drilldown level. If it is further drilled down it affects the performance. (can see the better change in results if data volume is huge).
Default view of matrix when drilled down to fourthlevel in report –

Time taken is shown in DAX studio which is 7.2 seconds–
When drilled down to 2nd level in report by default time taken is 1.8 seconds –

- Avoid too many page level filters, it improves performance.
- Try to avoid too many slicers in same page.
- Avoid Many to Many relationships between tables.
- Try to avoid using cross filter option as ‘Both’ under relationship settings. Instead use ‘Single’
- If any report page tooltip is created avoid too many visuals in report page tooltip so that it loads fast.
- If there is past 2 to 3 years data in the report, add a date slicer and filter it to current year or any one year to make the report load faster.
Finally, the total time taken to load the report can be checked by opening published report in incognito mode to get the accurate results. For the first time it might take some time based on the volume of data in your report. Next subsequent loads would be very fast i.e. 3 to 4 seconds.
Critical Important Points to Improve Power BI Report Performance
Get the total time taken by visual to load using Performance Analyzer in Power BI Desktop and check on the results.
- Analyzing on DAX queries created in measures and in visuals using DAX Studio.
- Checking on volume of data consumed by different columns in tables using Vertipaq analyzer.
- Use multiple level of aggregated tables either in Power BI or in data source if you are having control, for reducing data volume. Size can be reduced even by removing unnecessary columns that is taking ample space.
- Analysis on report level modifications such as page level filters, number of visuals/slicers, volume of data that is loaded into the report.
- Checking on the level of drill down and avoiding sort functionality in matrix.
- Limiting the data in the visuals in the page by restricting it to 1 year or less than that using date slicer.