Agentic Tableau to Power BI Migration Guide: A Step-by-Step Approach

Vasu

Introduction
Tableau’s message is analytics for everyone, from anywhere. And they have a point. It lets businesses easily, securely, and smoothly connect, visualize, and share data without coding. Tableau offers a versatile, complete platform to make sense of business data—from connection to collaboration.
Given this context, you might be curious not just about how to migrate from Tableau to Power BI, but how to modernize BI environments faster and more reliably using agentic AI–enabled automation like Agentic BI Modernization Suite. My aim is to explain the logic behind why this change is beneficial and the Tableau to Power BI migration approach involved. This Tableau to Power BI Migration Guide explores the details of this migration, discussing the step-by-step process.
Why Are Enterprises Choosing to Migrate from Tableau to Power BI?
Power BI was created for non-technical users from the beginning. The goal is to let business professionals of all kinds see important data, something that only IT and data staff could do before.
Even though Tableau has a lot of market share, Power BI’s use as the best cloud-based SaaS data analytics and BI solution since its 2014 launch has risen because it is:
- User friendly
- Feature rich
- Cost effective
Some of the benefits of Power BI are:
- Allows businesses to discover new insights from their data that they never had before
- Improves the access of more staff members to more information.
- Supports organizations in creating a culture based on data.
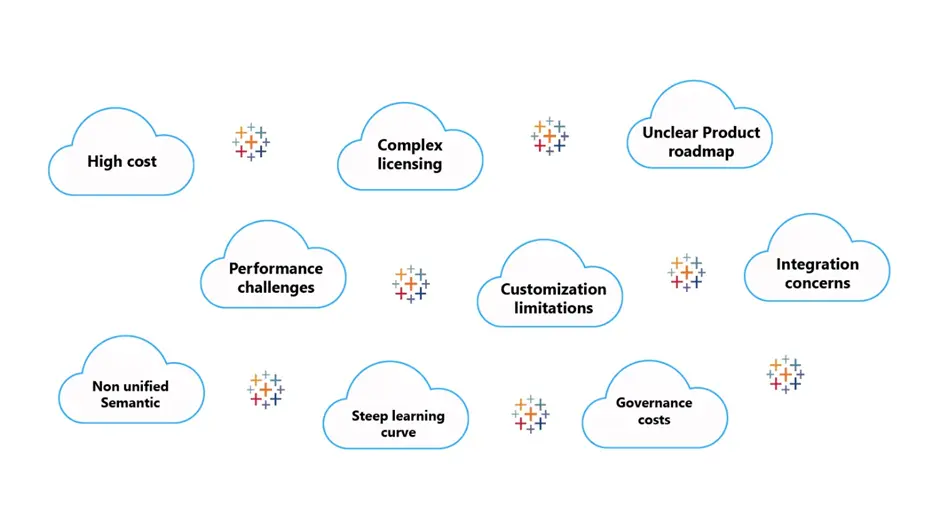
However, many companies are scared of switching to a new platform even though they know that migrating to Power BI will offer them advanced features, better integration options, and more customization capabilities to improve their data visualization. Yet, Tableau to Power BI migration challenges remain a concern. They have many problems (shown below) with Tableau.
Automated Tableau to Power BI Migration
At WinWire, we guide companies through the whole process of moving and modernizing BI assets from Tableau to Power BI using our framework-led approach supported by Agentic BI Modernization Suite, an agentic AI automation engine that accelerates discovery, rationalization, modernization, and validation. Our agentic BI modernization capabilities help accelerate each step with intelligent automation and data maturity insights.
WinWire Power BI Services
| Consulting & Assessment | Integration & Migration | Dashboard Implementation | Power BI Governance |
| Roadmap definition | Architecture | Best practices for dashboard build | Administration |
| BI / Visualization Architecture | Model design and build | Factory Model | Security and Access |
| Mockups focused on business personas and end user experience | Integrate with multiple sources | Business user enablement | Environment Health check |
| Migrate from other technologies | Insights and Analytics development | Sharing and Publishing practices / guidelines | |
| Self Service | IT and Business Collaboration |
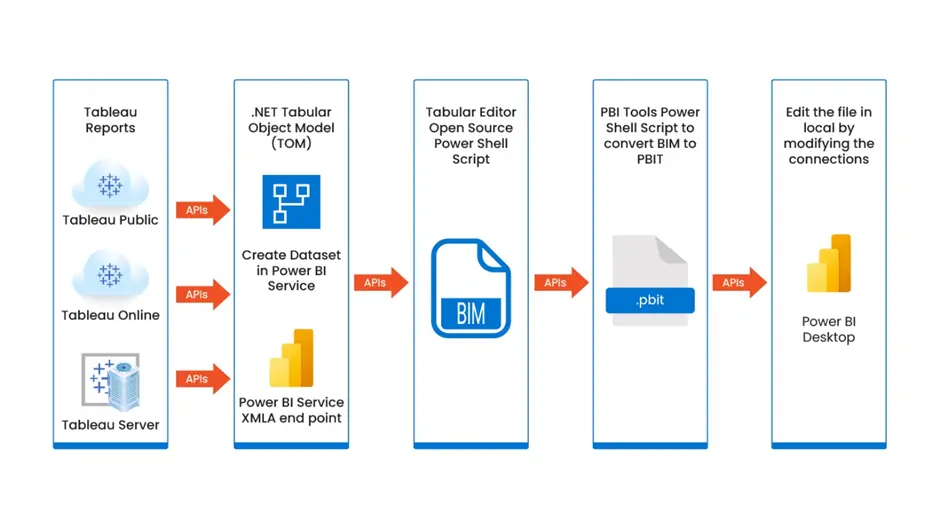
Tableau to Power BI Migration Process
Instead of using a lot of text to explain the migration process we use at WinWire, I prefer to show you this infographic. It can visually convey more information. A picture is worth a thousand words, after all.
Why Power BI better than Tableau for Enterprise Analytics
Here are the six main benefits of switching to Power BI (besides enjoying faster time-to-market, increased revenue, and improved customer service):
- Quick to start – Power BI is a very flexible, user-friendly BI solution mainly because of its straightforward user interface that resembles Microsoft Excel. It does not require technical skills – or training – to use, and it can connect with data sources of all types (whether it is an Excel spreadsheet or a mix of cloud-based/ on-premises hybrid data warehouses).
- Boosts business user efficiency—Power BI’s engaging, dynamic dashboards reduce time by offering business users quicker access to relevant information in real-time. Viewers find solutions and spot opportunities quickly. Studies have shown average savings to be ~1.25 hours per week, with overall organizational benefits around the $3.6 million mark.
- Reduces total cost of ownership (TCO) – Power BI lets many users see and change visual data sources quickly, which helps them analyze and show data differently. Power BI makes data more accessible and useful for users without enlarging the main IT and analytics team. Forrester says that the TCO savings over three years are $2.3 million.
- Supports compliance and regulation requirements – Power BI helps companies use secure data analytics with proper data separation. This prevents data security breaches because users can’t access information they shouldn’t. It also handles internal and regulatory compliance.
- Fosters user innovation – Power BI provides a single platform for data analytics. It offers users ‘semantic models, a toolkit for application lifecycle management (ALM), a framework to connect to various sources, and paginated reports with fixed layout and pixel accuracy.’ Users get weekly and monthly updates that enhance Power BI’s features and abilities.
- Enhances employee satisfaction – Power BI fosters a culture of data within organizations because it supports data accessibility. When employees can use more data (than before) and become data-savvy, they feel more confident, which leads to lower turnover rates.

How to start using Power BI?
For most organizations, Power BI is easy to start using. The software is similar to Excel. You can try the Power BI software for free without a license until you want to share your visuals and reports or do more advanced things.
Tableau to Power BI Migration Process : WinWire’s Proven Framework and Methodology
Win With Power BI helps enterprises to switch to the best visual analytics experiences on Power BI by quickly and smoothly moving from existing BI/ reporting solutions using automation tools and best practices. The benefit
- Licensing costs go down up to 75% through faster migration and modernization outcomes powered by agentic AI insights
- Up to 50% less effort in rebuilding models in Power BI
- 25% – 30% less effort in creating/converting Dashboards
- Innovative Metadata Driven Accelerator boosting migration cost savings
- Fast business adoption of Power BI through programs such as Dashboard in a Day
- Ability to embed insights within applications/processes
- Enable a highly secure, integrated, and Analytics capability
Tableau to Power BI Migration : Case Study
A leading health system in North America with a faith-based approach had problems with Tableau’s performance and needed to switch quickly because of the high cost of licensing and the demand for a better data analytics platform.
Business Challenge:
- Challenges with Tableau: sluggish visualizations, heavy CPU consumption, and costly licensing with the increasing workload.
- Various data sources and the need to switch quickly to save on renewal expenses.
Solution
- Moved to Azure, using Power BI for analytics, saving more than 40% in license costs.
- Used the “Win with Power BI” tool for inventory evaluation and complexity analysis, improving the report and dashboard inventory.
- Adopted an Agile method for a smooth migration and rebuild of Power BI reports, avoiding interference with normal business operations.
- Enabled enterprise-wide use of Power BI with initiatives like Dashboard in a Day (DIAD).
Business Value
- Reduced costs and better performance with a modern data estate in Azure.
- Improved ability to make decisions using optimized data models and reports.
- More flexibility in data analytics processes, giving 3900+ users valuable insights.
- Maintained business operations and user engagement during a vital migration phase.
Get in touch with us to learn more about how we have helped organizations achieve successful outcomes by migrating from Tableau to Power BI.

Getting Started: A Tableau to Power BI Migration 4 Week PoC
With our Win with Power BI accelerator – a pilot-led modernization approach powered by agentic AI automation that accelerates discovery, rationalization, and migration outcomes.
Make the switch to Power BI today and harness the true power of your data. Download our eBook to embark on a journey towards enhanced analytics, streamlined operations, and empowered decision-making.