Validating an Observability Migration at Scale with Agentic AI

Mahesh
How we automated the verification of hundreds of dashboards, alerts, and SLOs during a New Relic to Grafana LGTM migration.
By Mahesh Shekharapp
The Validation Gap Nobody Budgets For
Your team has just moved its observability stack off New Relic and onto Grafana’s LGTM stack (Loki, Grafana, Tempo, Mimir). Dashboards, alert policies, SLOs (Service Level Objectives), the lot. The queries are converted and the dashboards rebuilt. Then someone asks the question that stops everything: “How do we know it’s actually correct?”
Every migrated panel must show the same numbers as its New Relic counterpart, and every alert must fire on the same conditions and thresholds. SLOs have to report the same compliance and burn rates too. If not, teams lose confidence, and real incidents can slip through unnoticed.
Manual validation, two browser tabs, matched time ranges, results in a spreadsheet, takes 15 to 20 minutes per panel. Across hundreds of assets, that’s slow and hard to evidence. So we automated it.
What Migration Validation Actually Checks
Validation proves every migrated asset behaves equivalently to its original: same values over the same window, semantically sound queries, and preserved thresholds and visualization types. Skip this and a platform’s trustworthiness stays unknown until a broken filter or alert surfaces during an incident. At enterprise scale, sampling misses defects and full manual review is impossible to staff.
Four Pipelines, One Philosophy
We split validation into four pipelines, each targeting a different migration artifact, sharing one rule: back every verdict with evidence.
- Dashboard Data Comparison screenshots every panel in both tools, reads values with a vision model, matches panels by title, and produces a PASS / FAIL verdict with embedded evidence.
- Dashboard Definition Validation is a shift-left gate comparing the New Relic and Grafana JSON definitions directly: query syntax, visualization mapping, transformations, and hardcoded values, without running a live query.
- Alert Validation compares each New Relic condition against its migrated Grafana rule on results, thresholds, windows, and routing: can this alert be safely decommissioned?
- SLO Validation compares migrated SLO dashboards against New Relic service levels, error budgets, and burn rates, with evidence for every SLO.
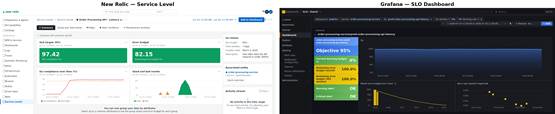
Example evidence pair: the same SLO rendered in New Relic (left) and the migrated Grafana SLO dashboard (right), captured over an identical time window.
Why Screenshots, Not APIs?
Our first iterations compared numbers pulled from both platforms’ APIs, and it kept producing disputes: the API returned one value, the UI showed another. Timezone handling and rounding can make a rendered UI diverge from a raw response, and a report that passes while a human sees different numbers is worthless.
So we flipped it and made the UI the source of truth. A real Chromium browser drives both applications, applies the exact time window, and reads the same pixels a human reviewer would see.
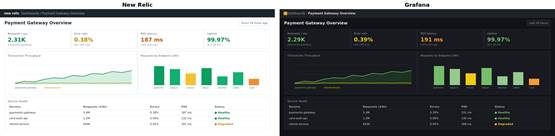
The two platforms render the same data differently. Validating at the UI level catches what API comparison misses.
This makes the reports self-evidencing: any stakeholder can verify a verdict quickly.
Where Agentic AI Comes In
Conventional scripting handles browser automation, JSON retrieval, and reporting; three parts of the problem needed more.
- Reading values from screenshots: extracting a stat-panel figure or judging chart shape needs real visual understanding, which a vision model provides natively, no per-panel OCR templates.
- Judging query equivalence: an NRQL (New Relic Query Language) query and its PromQL (Prometheus), LogQL (Loki), or TraceQL (Tempo) translation are never textually identical. Deciding equivalence, or a bug versus an acceptable artifact, is a reasoning task handled with learned rules, not pattern-matching.
- Orchestration: each pipeline coordinates sub-agents in parallel; ambiguous cases get classified explicitly. Deterministic Python handles what should be deterministic; the AI does the looking and the judging.
Who Validates the Validator?
Can you trust an AI pipeline to grade a migration? Only if its own errors stay visible and contained. We measured the vision model’s readings against expert human review; they agreed roughly 95% of the time. That’s why every verdict ships with evidence screenshots: a reviewer spots a misread value in seconds, and corrections feed back into the rule set. The design makes mistakes cheap to catch.
Anatomy of a Validation Run
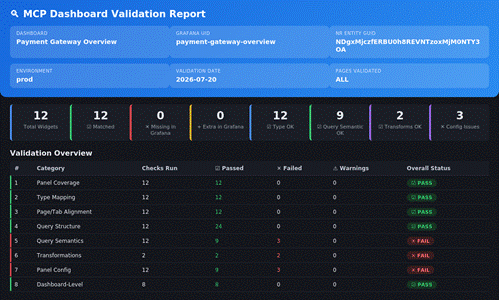
A validation report for a single dashboard: widget counts, matched panels, and pass/fail status across each check category.
Each run follows the same flow: QA lists items to validate in an input workbook, with identifiers for both platforms and a target window; only marked rows run. Time windows are normalized to UTC on both sides; a window mismatch is flagged invalid, not reported as a defect. Sub-agents fetch definitions from both platforms in parallel over the Model Context Protocol (MCP), then match items by title, where unmatched items are themselves findings. Playwright captures every panel through authenticated sessions, values are compared against a variance threshold, and the run produces one report: one row per item.
The Technology Stack
| Component | Technology | Role |
| Agentic AI orchestration | Claude by Anthropic | Orchestration, visual extraction, and query comparison via sub-agents |
| Platform integrations | Model Context Protocol (MCP) | Secured connections to New Relic and Grafana APIs |
| Browser automation | Playwright with Chromium | Authenticated UI automation and screenshot capture |
| Backend processing | Python | Input parsing, panel matching, comparison, and reporting |
| Reporting | Excel + HTML | Workbook-driven execution; evidence-rich, shareable reports |
Key Lessons Learned
Evidence beats assertion. Embedding screenshots drove adoption; stakeholders stopped asking “are you sure?” because they could see for themselves.
Most early failures were not defects at all. Two systems were simply showing different periods, a mismatch now caught before any value comparison.
Never modify the source query. Early versions reformatted queries and introduced syntax errors. Now queries run untouched except for the appended time clause.
The real work turned out to be browser automation. Fetching JSON is easy; keeping sessions stable across SSO and catching blank captures is not.
Results and Impact
The suite has validated more than 80 dashboards (roughly 3,200 panels), 50 alert policies covering over 200 conditions, and 250 SLOs, catching defects like missing filters, hardcoded service names, incorrect query intervals, and threshold drift before cutover, cutting post-cutover P1 (priority-one) issues by at least 70%. Moving from 15 to 20 minutes of manual comparison to 1 to 2 minutes per panel saved an estimated 850 hours of QA effort, roughly five months of one engineer’s time, agreeing with human review roughly 95% of the time. The bigger shift is organizational: teams that once needed meetings now review a link and sign off.
One catch shows the value concretely. A request throughput panel returned a FAIL: New Relic reported roughly 1,240 requests per second, the migrated Grafana panel about 1,150, a variance above 7%. The PromQL had a hardcoded one-minute rate interval instead of Grafana’s dynamic interval, silently undercounting during scrape gaps. The panel looked plausible alone; only the side-by-side comparison exposed it, fixed before cutover.
Limitations
The suite is not magic. Vision extraction is weakest on dense, high-cardinality panels like heatmaps and long tables, which route to human review more often. Runs consume real AI inference time and cost, so they’re batched per migration wave, and browser automation stays sensitive to authentication changes and slow-rendering panels.
Conclusion
Observability migrations succeed or fail on trust, and trust gets earned one panel at a time, then one alert, then a couple hundred more. Pairing deterministic automation with agentic AI turned a multi-hour manual chore into a run that finishes in minutes and hands stakeholders evidence instead of assurances. The pattern applies well beyond New Relic and Grafana. Any migration where two systems must agree on the same facts can screenshot the truth and let AI read it, with a human in the loop where it matters.