Power BI Testing Guide: From Data Validation to Report Accuracy

Prajval

Data quality and report quality get treated as the same problem more often than not, and that’s usually where trouble starts. A dashboard can be built on flawless data and still mislead someone looking at it, or it can be visually polished while quietly reporting the wrong numbers underneath.
Telling those two failure modes apart, and testing for both, is what separates a Power BI QA process that catches real problems from one that just checks boxes.
Data Quality vs. Report Quality
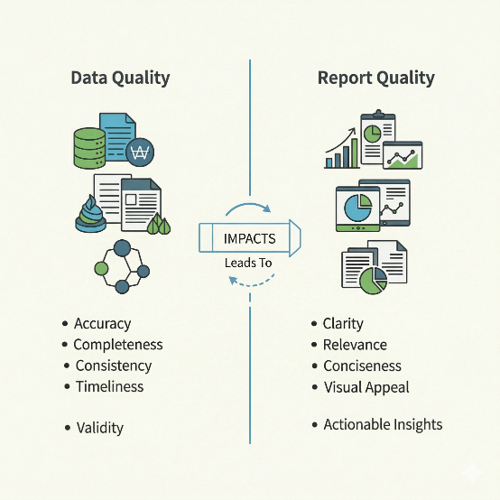
Here’s a simple way to think about it: Data QA checks that the numbers are right. Report QA checks that the numbers are shown right.
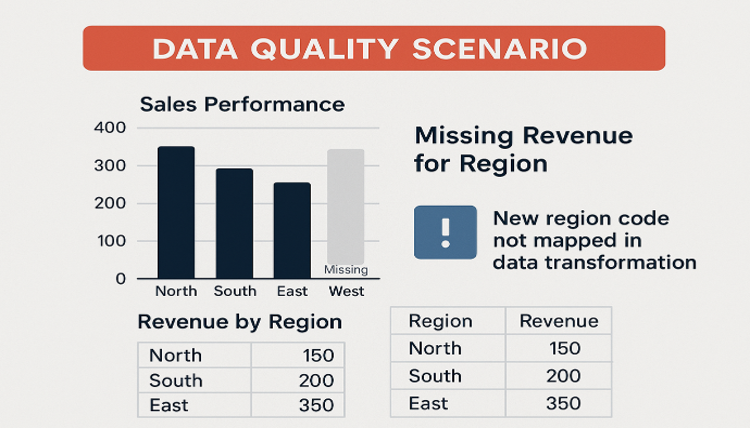
Data quality example: one team found their sales report was missing revenue for an entire region. A new region code had been added upstream but never mapped during transformation, so those records just got dropped from the aggregation without anyone noticing.
Report quality example: a KPI dashboard was showing inflated Year-to-Date sales. The data itself was fine. The problem was a DAX measure that ignored slicer context, so the calculation logic was quietly misleading everyone who looked at it.
| Aspect | Data Quality | Report Quality |
| Definition | Accuracy, completeness, consistency, timeliness, and reliability of raw data. | How well reports present, interpret, and communicate data to end users. |
| Focus Area | Input (raw or processed data). | Output (reports built from data). |
| Key Attributes | Accuracy, completeness, consistency, validity, uniqueness, timeliness. | Clarity, relevance, correctness, usability, visualization, structure. |
| Purpose | Ensure data is trustworthy and reliable for decision-making. | Ensure stakeholders can understand, interpret, and act upon insights. |
| Dependency | Independent of report design (data can be high quality but reports poor). | Dependent on data quality (poor data limits report effectiveness). |
| Measurement | Data profiling, validation checks, cleansing rules, error rates. | User satisfaction, readability, actionable insights, business alignment. |
| Responsibility | Data engineers, database admins, data governance teams. | BI developers, analysts, report designers, business stakeholders. |
| Impact if Poor | Wrong or misleading raw information, failed integrations, incorrect analytics. | Misinterpretation of results, poor decisions, lack of trust in insights. |
| Example | Customer record missing email address or wrong date of birth. | Sales dashboard cluttered with visuals or misleading charts despite correct data. |
| Improvement | Cleansing, deduplication, validation rules, master data management (MDM). | Better visualization design, clear KPIs, contextual explanations, user-friendly UI. |
The Three QA layers
Power BI QA really comes down to three layers, and the Model Layer sits right in the middle. It’s the handshake between the data and the reports built on top of it:
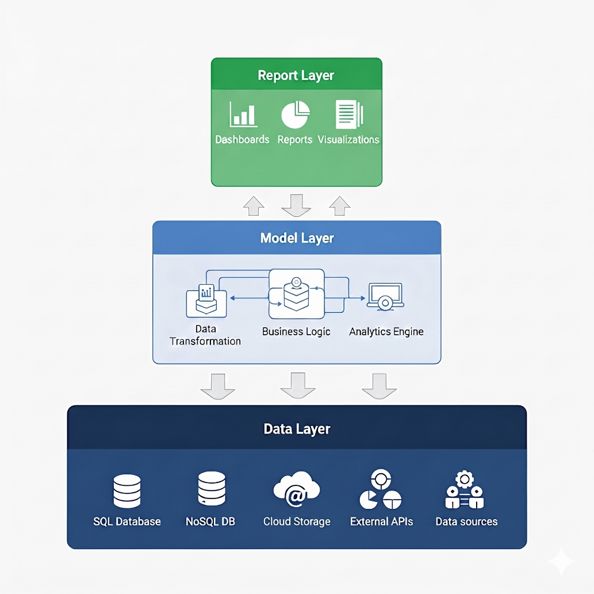
- Data Layer: Covers accuracy of the source, the ETL process, and staging. In practice, this means confirming that data pulled from source systems is complete and was transformed correctly before it ever reaches Power BI. Say a sales table refreshes every day. Data Layer QA is what confirms yesterday’s transactions actually made it in, and that dates or currency values weren’t mangled somewhere along the way.
- Model Layer: Validates relationships, calculations, and security. This is where you check that table relationships, DAX measures, and role-based access all behave the way they’re supposed to inside the semantic model. A classic example is a mis-set relationship that quietly double-counts revenue the moment two tables get joined. Model Layer QA is what catches that before it reaches a dashboard.
- Report Layer: Tests visuals, filters, design, and the overall narrative of the report. This one’s less about whether the numbers are correct and more about how they’re displayed and consumed. Think of a slicer that doesn’t actually filter one of the visuals on the page. The data and the measure behind it might be perfectly accurate, but the report is still misleading whoever’s looking at it.
Tools that make QA practical
- Power Query Profiling. Spot blanks, duplicates, and invalid values early
- Dataflows with Quality Gates. Null checks, range validation, schema conformity before data hits the model
- DAX Studio. Validate complex DAX logic and tune performance
- Tabular Editor. Review and script the semantic model’s structure, measures, and naming conventions outside Power BI Desktop
- Power Automate. Alert on refresh failures or anomalies
- Conditional Formatting. Flag anomalies directly in visuals
Put these together and QA turns from a one-off manual check into something continuous and repeatable.
Automated Power BI Validation Framework: A Practical Implementation
DAX Studio and Power Automate cover a lot of ground, but once you’re validating reports across Dev, UAT, and Production, or running a migration project, you need something closer to end-to-end automation. That’s why we built an automated batch comparison framework that handles source-to-target validation at scale.
Framework architecture
- Extraction Engine. Browser automation using Selenium WebDriver, with a persistent Chrome session that keeps the login cookie alive across runs so the framework doesn’t have to sign back in before every extraction. It also handles automated visual data export (CSV format), using a two-tab model for Source and Target environments in a single session
- Validation Engine. Pandas-based data comparison with automated normalization (decimal precision, whitespace, case sensitivity), row count, column count, and schema validation, plus cell-level data difference detection
- Orchestration Layer. A Flask-based web dashboard for configuration, batch processing of multiple visual pairs, real-time progress tracking, and validation reporting
Key Capabilities
The framework covers three kinds of comparisons. Environment-to-environment validation checks Power BI reports across Dev, UAT, and Production, so migrations and report version changes get caught before they turn into unintended discrepancies downstream. Cross-platform validation applies the same logic to Qlik exports, which is useful for migration QA off legacy platforms or for confirming two BI tools agree on the same numbers.
It also runs automated regression testing: scheduled validation batches, multiple visual pairs configured in a single test run, and execution that continues past individual errors so one failed comparison doesn’t stall the whole batch. Each run ends with a full summary of what passed and what didn’t.
Real-world application
Scenario: A Financial services client was migrating more than 50 Power BI reports from a legacy environment into a modernized workspace. Doing that validation by hand would have taken weeks and been prone to mistakes.
Solution: the QA team set up over 200 visual pairs (source versus target) in the framework and ran the batch validation overnight. The comparison reports came back flagging 15 discrepancies, all traced to incorrect DAX filter context in the target environment.
Result: validation time dropped from three weeks to two days, and every data integrity issue was caught before the release went to production.
Integration with the QA lifecycle
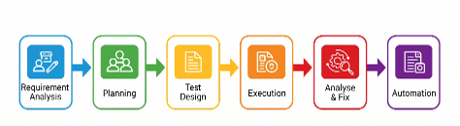
This framework slots directly into the Analytics QA Lifecycle:
- Test Planning. Define visual pairs and acceptance thresholds
- Test Execution. Run automated batch validations
- Analysis & Fixes. Review diff reports and trace root causes
- Automation. Schedule recurring validations for regression testing
Once this is embedded into the deployment pipeline, QA catches problems before they ship instead of after, which is the whole point of automating it.
Copilot as a QA assistant
Power BI Copilot’s DAX Query View lets QA teams write validation queries in plain English, so you don’t need to be fluent in DAX to use it. Type something like “show total revenue by region excluding returns for Q1” and check the result against what the report visual is showing.
It’s also useful for sense-checking during UAT. You can ask things like “does this YTD figure look consistent with monthly trends?” or “are there outliers in this visual?” If Copilot’s read of the data doesn’t match what you’d expect, that’s usually worth a closer look.
Bringing it together
A mature QA process really just borrows from software engineering. Figure out what needs testing, plan the approach, design the test cases, run them, fix whatever broke, and automate it so you’re not doing it all by hand next time.
Best Practices
- Automate source-to-dashboard reconciliations. You want mismatches caught right away, not during a stakeholder review.
- Use Power Query profiling consistently. It catches blanks and invalid values before they ever reach the semantic model.
- Document lineage for your DAX measures and transformations. When a number looks wrong, you want to trace it back to its source in minutes, not hours.
- Involve business users in UAT. Reports need to hold up against real usage, not just technical correctness.
- Integrate QA into your CI/CD pipelines, so every ETL, model, or report change gets tested before it reaches production.
Conclusion
Power BI QA works best as a habit spread across the data, model, and report layers, not a single gate before launch. The three-layer split gives you a place to look when a number seems off, and a validation framework gives you a way to catch drift before a stakeholder does. None of it is complicated: profile the data early, check the DAX logic before it ships, run a batch comparison before a migration goes live. What it takes is building those checks into the process instead of bolting them on afterward. Teams that do this find their discrepancies in a diff report, not in a leadership meeting.