Tableau Server Architecture Explained: How Enterprise Dashboards Really Work

Sunil

A dashboard in Tableau appears simple when viewed in a browser. Before becoming visible to the end-user, many things happen in the background. In an enterprise-level environment, dashboard data comes from various sources, including ERP systems, CRM systems, databases, cloud applications, and APIs. The data passes through ETL/ELT processes to be ready for reporting.
Tableau Server handles data access, query processing, workbook, and dashboard serving. The objective of this blog is to describe the enterprise Tableau server architecture to understand what happens before a dashboard is generated and where performance issues could arise.
What Is Tableau Server Architecture?
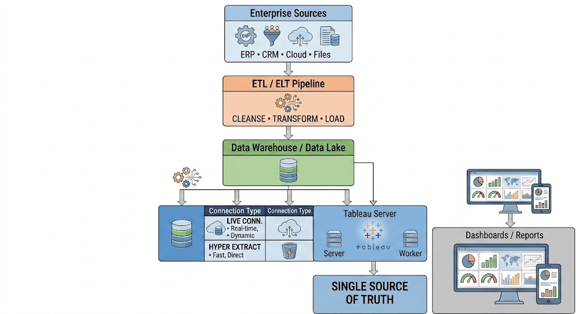
Tableau Server is rarely the starting point for enterprise analytics. Data comes from various sources, passes through ETL/ELT processes, and lands in a data warehouse or data lake. It is always advisable to keep reporting separate from day-to-day operational systems and applications.
These systems support business operations and should not be used for direct analytics query processing. Tableau server can connect to data sources through a Live Connection or Hyper Extract. Using a live connection means querying the database every time a dashboard is refreshed or a report is opened. With Hyper Extract, queries are run against the extracted copy of the database.
The decision to use a live connection or an extract depends on the business’s needs. Some dashboards require near-real-time analytics and cannot use extracts because data would not be up to date. Others analyze the same dataset periodically and benefit from using extracts.
Architect’s Tip:
I always endeavor to keep Tableau workloads on the analytical platform rather than connecting directly to operational databases.
What Are the Core Components of Tableau Server?
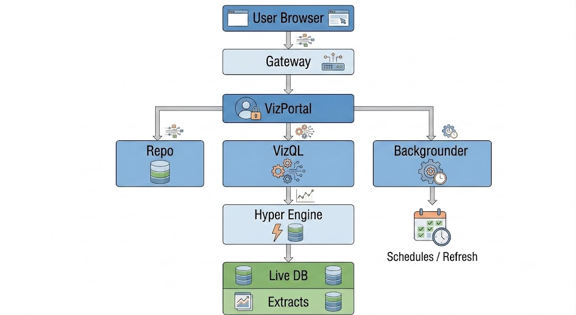
Whenever a dashboard is requested, Tableau Server processes the request. The Gateway component receives all incoming requests and directs them to the appropriate service. The Vizportal serves dashboard content while managing authentication, permissions, and user sessions. VizQL processes Dashboard logic and produces dashboard elements such as graphs, tables, and visual analytics.
When using extracts, Hyper processes queries against the extracted copy of the database.
Backgrounder is the component that manages Tableau background jobs, such as extract refreshes, subscriptions, flows, and alerts. The Repository stores , such as metadata for users, permissions, projects, workbooks, dashboards, and schedules.
In a production environment, Tableau components can be distributed among several servers depending on the traffic volume.
Architect’s Tip
When I troubleshoot performance issues in a Tableau environment, the first place to look is always at the database. If dashboard workbooks are running slow, there is often an issue with the extract, data model, or the underlying database.
What Happens When a User Opens a Tableau Dashboard?
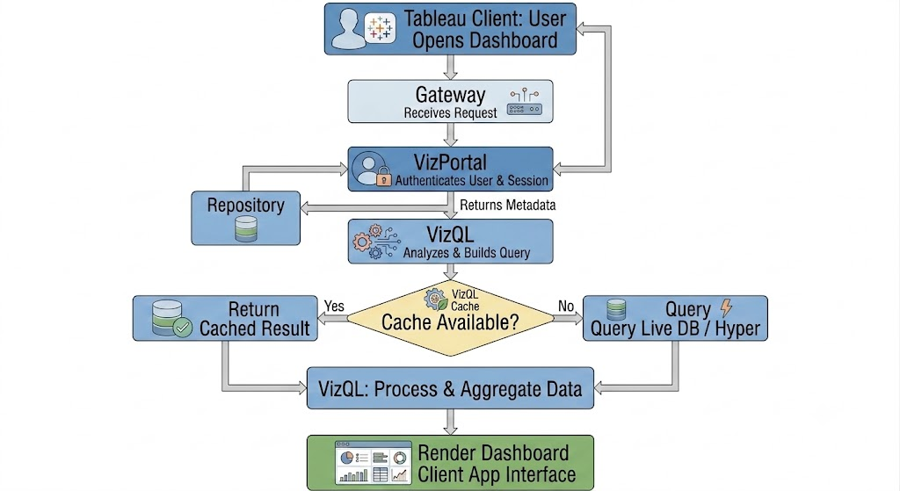
Let’s walk through what happens when a dashboard is requested. Suppose I want to open a sales dashboard. The request initially goes to the Gateway component. Tableau checks the permissions and verifies if I have access to the workbook. Access to the workbook requires permission on the objects and data sources it contains. This information is stored in the Repository.
VizQL identifies what the dashboard needs and checks the VizQL cache to identify if any results have already been processed. If the results are available in the cache, Tableau uses the existing information to recreate the dashboard. On the other hand, if the results are not available, VizQL processes the query and sends it to Hyper or the database if it is a live connection. Finally, Tableau uses the query results to recreate the graphs, tables, visual analytics, and other dashboard elements the next time it is accessed. It is important to note that several tableau components are involved in this process.
Architect’s Tip
When analyzing performance issues with dashboards, always consider the analytics platform, data warehouse, extracts, query processing, calculations, and workbook structure.
How Do You Design Tableau Server for Enterprise Scale?
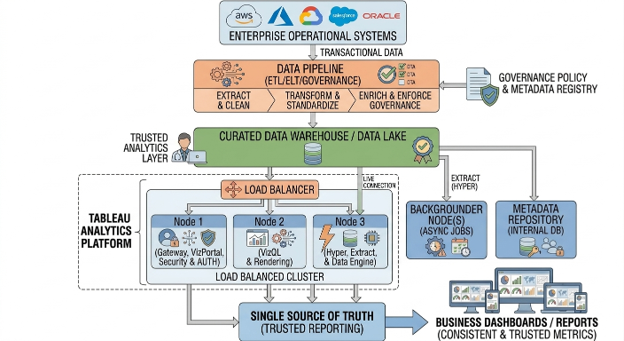
When designing this architecture for enterprises, it is important to keep a few aspects in mind. Tableau can be horizontally scaled to handle increased workloads. A Load Balancer distributes dashboard requests among multiple Tableau server nodes. Tableau can be integrated with enterprise-level authentication platforms such as Active Directory, LDAP, and SAML.
It is critical to design a proper security model that enforces the principle of least privilege. At the same time, a formal governance policy must be developed to manage the analytical workloads. Without governance, anyone can upload workbooks and data sources, leading to duplication of efforts and lack of standardization. It is important to set standards on certified sources, project structures, workbook naming conventions, security models, owners, etc. Tableau’s production environment also requires backup and disaster recovery strategies.
Architect’s Tip
A Tableau environment can be scaled up quickly; you should have a proper governance policy in place before launching it in the enterprise environment. Without governance policies, Tableau environments can become disorganized and messy over time.
What Causes Tableau Dashboard Performance Issues?
- Underlying database or data model problems — When dashboards run slow, the root cause is often the extract, data model, or the source database itself, not Tableau.
- Direct connections to operational systems — Querying live operational databases instead of a dedicated analytical platform adds unnecessary load and latency.
- Poor extract or query design — Inefficient extracts or unoptimized queries force VizQL and Hyper to do more work each time a dashboard loads.
- Weak governance and workbook sprawl — Without standards on certified data sources and workbook structure, duplicated or poorly built content can degrade performance across the environment.
Key Takeaways: Building a Governed, Scalable Tableau Environment
A dashboard is the result of a series of processes that begin with data in enterprise systems. Before it gets to Tableau, data passes through various data preparation tools, ETL/ELT processes, and storage systems such as the data warehouse. Tableau Server has several processes that handle dashboard request validation, query processing, and analysis visualization.
This knowledge is critical when designing Tableau environments because it provides insight into the factors that influence dashboard performance. Armed with this information, it becomes possible to optimize Tableau performance and troubleshoot common issues that affect dashboards and reports.