Observability in Software Engineering: Why It Matters and How to Get It Right

Rakesh

The 2 AM War Room
It’s 2 AM. The SOS on-call alert fires. Your e-commerce checkout is broken. Orders are failing, and revenue is bleeding by the minute. The team runs to their dashboards. CPU? Normal. Memory? Fine. Error rate? Spiking, but on which service? They scroll through thousands of logs. A few anomalies catch someone’s eye, but nothing is conclusive. They have data – mountains of it. But there is no clue.
Understanding observability in software engineering is crucial for resolving issues quickly and efficiently.
This isn’t hypothetical. I’ve seen this pattern repeatedly across enterprise teams: significant investment in monitoring tooling, gigabytes of telemetry data flowing every second, yet hours spent triangulating the root cause of a production incident. The tools weren’t the problem. The missing ingredient was context.
Monitoring vs. Observability: Not the Same
Monitoring tells you that something is wrong. You define thresholds upfront, and the system alerts you when they’re breached. It’s a known-unknowns problem, meaning you can only detect what you thought to watch for.
Incorporating observability in software engineering can drastically improve system reliability.
Observability in software engineering tells you why something is wrong. It gives you the ability to interrogate your system’s behavior from the outside, asking arbitrary questions, including ones you didn’t anticipate when you built the system. It’s an unknown-unknowns solution.
Ultimately, observability in software engineering empowers teams to maintain high performance.
Through effective observability in software engineering, organizations can gain valuable insights.
This distinction matters enormously in modern distributed architectures. In a monolith, failure is relatively contained and predictable. In a system of 30 – 50 interdependent microservices running across cloud infrastructure, the failure you see is rarely where the failure began.
The Three Pillars of Observability: Metrics, Logs, and Traces Explained
Observability in Software Engineering is typically built on three types of telemetry data – widely known as the three pillars.
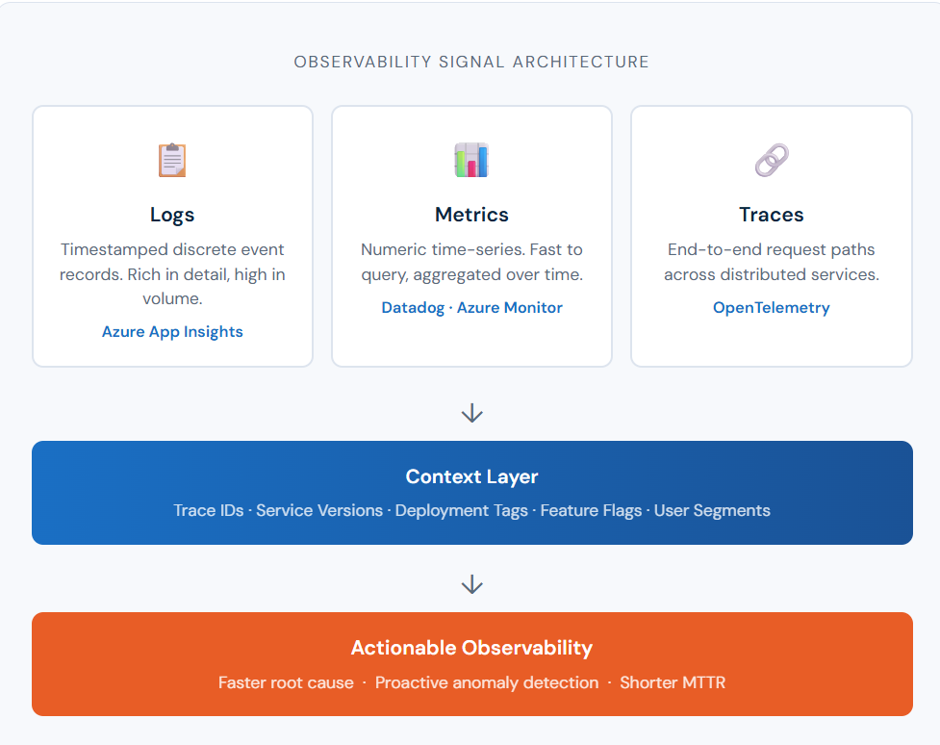
Logs
They are rich in detail and invaluable for forensic investigation. The challenge is that they’re noisy at scale, unstructured by default, and expensive to query. Without discipline around log structure and correlation, they become the proverbial haystack.
The role of observability in software engineering cannot be overstated; it is foundational.
Metrics
Metrics are numeric measurements aggregated over time utilization: request rates, error percentages, latency percentiles, CPU utilization, and queue depths. Tools like Azure Monitor and Datadog excel at metrics: they let you visualize trends, set intelligent alerts, and build capacity models. Metrics are low-cost, fast to query, and excellent for answering what changed – but they rarely answer why.
Effective observability in software engineering helps in understanding complex interactions.
To achieve better outcomes, prioritize observability in software engineering during development.
By emphasizing observability in software engineering, teams can quickly identify and resolve issues.
Traces
Traces follow a single request as it travels through your distributed system, from the API gateway, through authentication, into the order service, downstream to the payment provider, and finally into the database. A trace stitches these hops into a single timeline, surfacing exactly where latency accumulated and where failures cascaded. Open Telemetry has become the vendor-neutral standard for distributed tracing, and both Datadog APM and Azure Application Insights natively support it.
Integrating observability in software engineering practices is essential for modern development.
Investing in observability in software engineering will yield long-term benefits.
Together, the three pillars give you breadth (metrics), depth (logs), and flow (traces). That’s a strong foundation, but it’s not enough on its own.
The Missing Piece: Context
Here is the uncomfortable truth most organizations discover only during a major incident: raw telemetry data and true observability are not the same thing. The gap between them is context.
Context is what allows you to ask “Which tenant was affected?” Which deployment version introduced this behavior? What was the feature flag state at the time of this error? Which downstream service degraded first in the call chain?
Without context, your logs, metrics, and traces are isolated islands. A spike in your error metric doesn’t automatically correlate with the trace showing which service timed out. That trace doesn’t tell you the error only affects users in a specific geographic region. The log line doesn’t carry a correlation ID to connect it back to the originating request.
Contextual observability means enriching every signal, every log line, metric tag, and trace span with shared metadata: trace IDs, service versions, deployment identifiers, user segments, and environment labels. When every signal speaks the same language, you can move fluidly from a metric anomaly to the relevant traces to the exact log lines in seconds rather than hours.
In practice, Datadog’s unified platform does this well, correlating APM traces with infrastructure metrics and log management under a shared correlation ID. Azure Application Insights achieves comparable depth within the Microsoft ecosystem, linking end-to-end transaction diagnostics with dependency maps and live telemetry. The tooling, however, is secondary. Contextual observability is primarily a discipline of instrumentation, not a product feature.
Best Practices for Implementing Observability in Software Engineering
For architects and engineering leaders looking to mature their observability practice, the leverage is in these four shifts:
- Instrument with intention. Resist the urge to collect everything. Ask upfront: Where does latency originate? Where do errors propagate? What is the blast radius of a downstream failure? Let those questions drive your instrumentation strategy.
- Standardize correlation IDs. Every request entering your system should carry a unique trace ID, propagated across every service hop, every log entry, every metric tag. This single discipline transforms three isolated data streams into a coherent incident narrative.
- Adopt Open Telemetry early. It is vendor-neutral, widely supported, and prevents costly tool lock-in. Whether you are shipping telemetry to Datadog, Azure Monitor, or Grafana, OTel provides a consistent, future-proof instrumentation layer.
- Make observability part of your definition of done. If a feature ships without meaningful telemetry, structured logs, key metrics, and trace instrumentation, it isn’t done. Observability is a first-class engineering concern, not a post-deployment afterthought.
Thus, adopting observability in software engineering allows more informed decision making and enhances operational excellence.
From Data to Decisions
Organizations that genuinely win with observability are those that shift from a reactive posture, waiting for alerts to fire, to a proactive one, where engineering teams understand their system’s normal behavior well enough to detect anomalies before they become incidents.
That shift doesn’t happen by adding more dashboards. It happens when logs, metrics, and traces are connected with context, turning scattered signals into a clear, queryable story about system behavior. Any engineer can then understand what is happening, even outside the service they own.
The three pillars are necessary. Context is what makes them actionable.
At WinWire, we help engineering teams build observability practices that connect telemetry with context, so they can detect issues faster, reduce incident noise, and make systems easier to understand. If you’re looking to mature your observability strategy across cloud-native applications, we’d be happy to start that conversation.