Forecasting in Power View

Zia

Forecasting just got a whole lot easier with the additional capabilities Microsoft added to Power View for Office 365. Used for predictive analysis, these forecasting tools allow you to both visualize and analyze future trends and stats using historic data. You can also use it to measure how accurate the forecast is by utilizing the proven algorithm to create customized forecasts that give you the results you desire.
Exponential smoothing is the established methodology that is used for time series prediction that forecasting is based on. Not only has this method been proven in both business and academia, it offers another crucial advantage. Unwanted variations and noises that can alter the model can be suppressed while still effortlessly capturing trends.
Two versions of exponential smoothing were used by Microsoft: one for seasonal data and another for non-seasonal data. Using its analysis of the historical data, Power View automatically uses the relevant model when a forecast is started on a line chart.
• For its seasonal algorithm, Microsoft enhanced the Holt-Winters algorithm to make it less vulnerable to noise while also accounting for additive trend, seasonality and error.
• The simpler model, the non-seasonal algorithm, uses an equation that accounts for only additive error and trend without considering seasonality.
High quality historic data allows for a more accurate forecast. This is accomplished by measuring data at time intervals within succession, such as each year, month or day. Power Viewer can address gaps by adding up to 100% of the values that exist. Power View cannot forecast if the chart is missing more values.
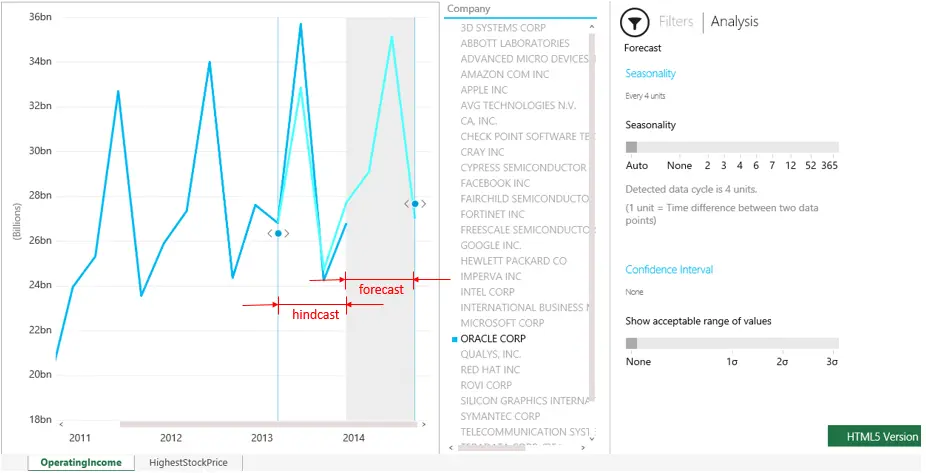
Hindcasting is a valuable tool that can help check the accuracy of the Forecast model. Using the small dot that is on your line chart, you can drag it forward and to the right to enable Forecasting. Drag the dot backward and to the left to a vantage point from the past and hindcasting is enabled. Hindcasting allows you to view how the model would have predicted the recent past and the present based on data that is older while also comparing it to the actual data you obtained.
There are few configuration options one could utilize to customize forecasting experience. These options provides flexibility which governs the forecast result/behavior.
Forecast results can be adjusted by:-
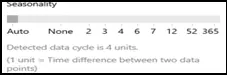
• Adjusting the Seasonality: Seasonality (or periodicity) is the number of time steps for a full data cycle. In the Analysis area, seasonality can be manually set to none, 2, 3, 4, 5, 6, 7, 12, 24, 52, or 365. Setting it to “none” will Forecast using the non-seasonal algorithm.
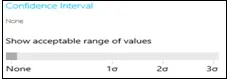
•Adjusting the Confidence interval: The confidence interval shows visually how reliable the forecast is. Standard deviation is the setting used for the confidence interval of forecast results. In the Analysis pane, Standard Deviation can be adjusted to show values with a standard deviation of 0, 1, 2, or 3.
• Adjust for outliers to explore what-if scenarios: The data points in a line chart can be changed (by dragging the dot up or down) to perform What-if analysis and the Forecast data changes accordingly. This will not change the underlying data in the data source.
I started exploring using few of my Data models and liked it as every minute passed by. I was amazed at how beautifully this new Forecasting capability would help the Leadership team in statistically analyzing the business trends and seasonal factors and support in critical decision makings.
References:
http://blogs.msdn.com/b/powerbi/archive/2014/05/08/introducing-new-forecasting-capabilities-in-power-view-for-office-365.aspx
http://blogs.msdn.com/b/powerbi/archive/2014/05/08/describing-the-forecasting-models-in-power-view.aspx